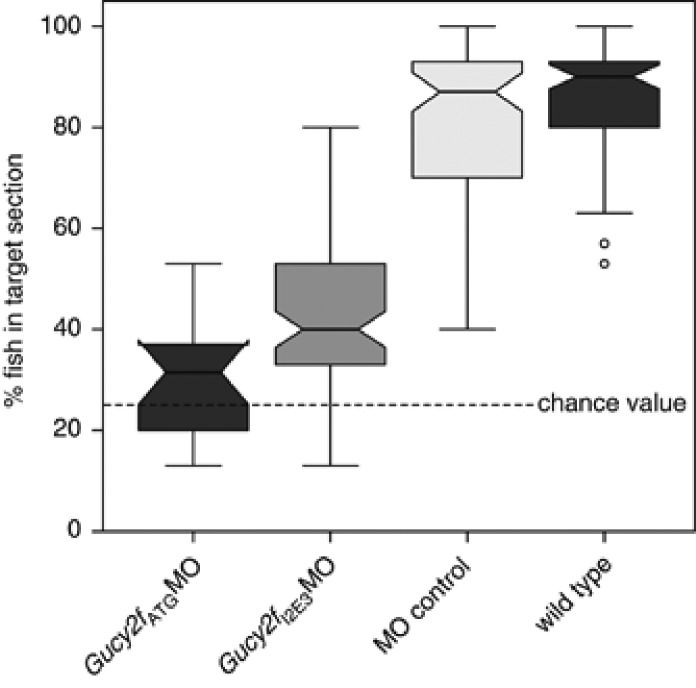
Figure 3.
Visual response of the zebrafish Gucy2fI2E3MO, Gucy2fATGMO, wild-type larvae and control MO-injected zebrafish. Group results are depicted as boxplots: the thick line indicating the median, the notch the 95% CI for the median, the boxes are the ±25% percentiles, the antennas the ranges and the outliers (1.5 × the interquartile range outside the quartiles) are represented as circles.

