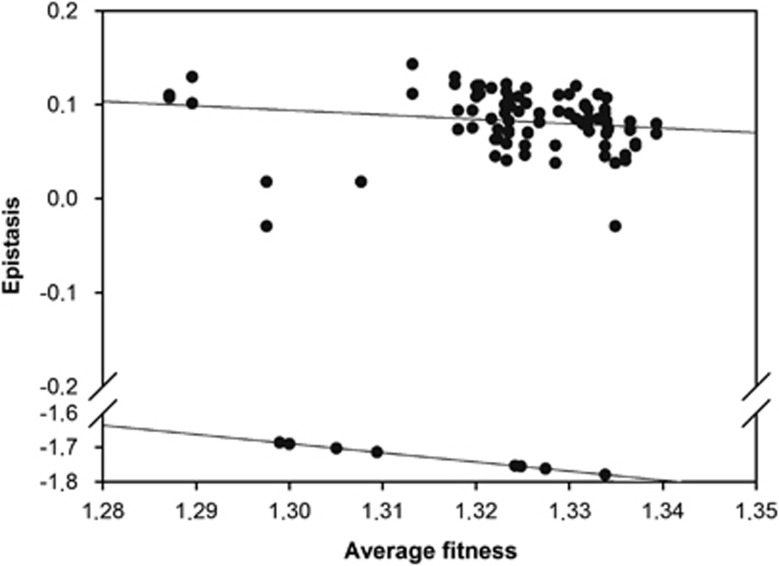
Figure 3.
Association between average mutational effects and the magnitude of epistasis. Two apparent relationships exist: one for pairs of mutations generating viable genotypes (upper cloud) and a different one associated to the SLs (lower cloud). The regression lines are included to illustrate the difference in the underlying relationship between epistasis and average mutational effects between both types of phenotypes.

