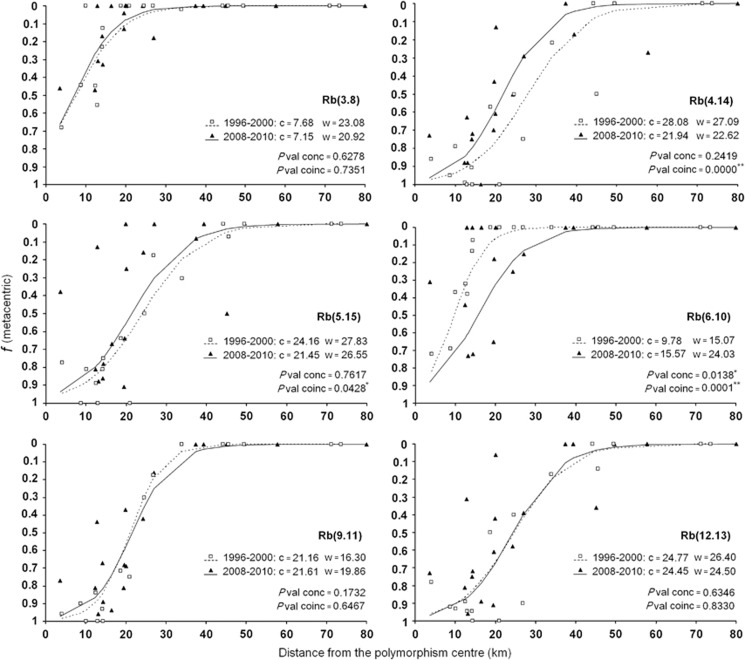
Figure 3.
Comparison of clinal patterns for each metacentric between 1996–2000 and 2008–2010 periods. Asterisk indicates significant values at P<0.05; Double asterisk designates significant values at P<0.01 after Bonferroni correction. Abbreviations: c, centre of the clines fitted; Pval conc, probability of concordance obtained in the maximum likelihood test between constrained and unconstrained models for clinal widths; Pval coinc, probability of coincidence obtained in the maximum likelihood test between constrained and unconstrained models for clinal centres; w, width of the clines fitted.

