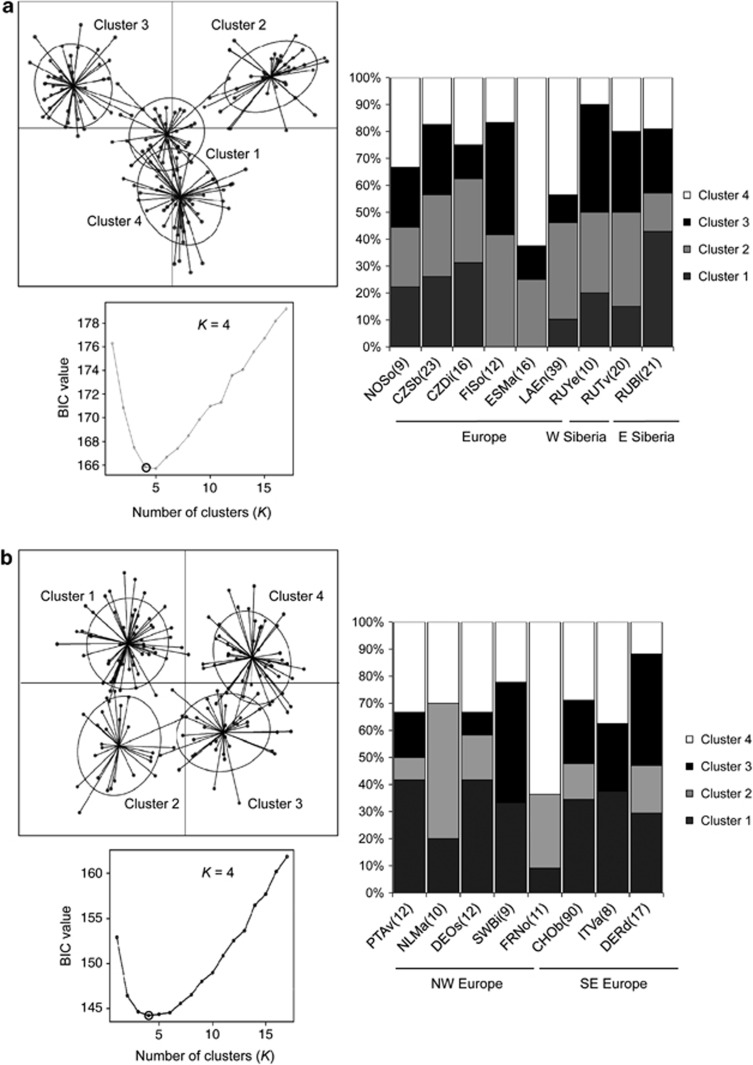
Figure 4.
Inference of genetic clusters using discriminant analysis of PCs (DAPCs) based on microsatellite data for tufted duck samples from breeding (a) and wintering (b) grounds. In each representation, the bottom-left plot shows the Bayesian information criterion for different numbers of clusters (K), with the optimal K indicated by a red circle. The scatter plots display the first two PCs of the DAPC for the optimal K. The inferred genetic clusters are displayed by inertia ellipses with dots representing individuals. The barplots illustrate the proportion of individuals from each sample assigned to each of these genetic clusters. Sample sizes are given in parenthesis after the sample names.

