
Figure 3.
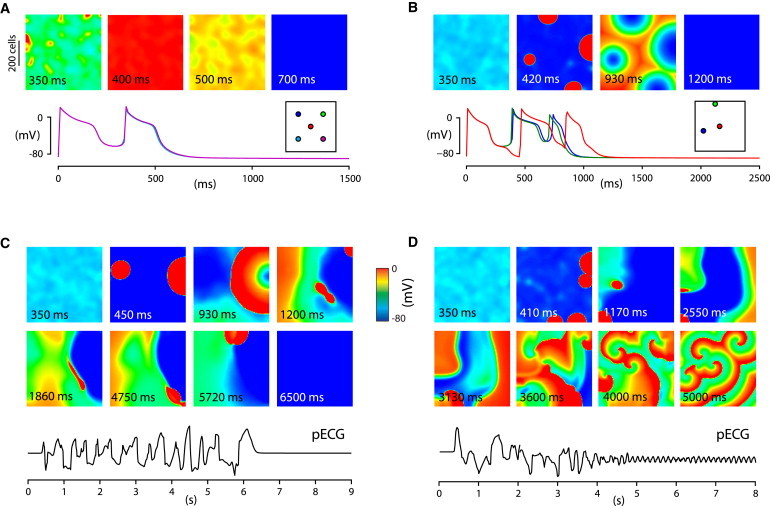
PVCs and arrhythmias triggered phase-3 EADs in two-dimensional tissue. Simulations of 600 × 600 cell tissue of phase-3 EAD model cells with σgCa = 35 mmol/(cm C) and 〈gCa〉 = 867 mmol/(cm C) (B–D) and 〈gCa〉 = 870 mmol/(cm C) (A). The entire tissue was stimulated once at t = 0. Membrane potential time series in panels A and B correspond to locations in the tissue (highlighted by circles of the same color in the inset). Pseudo- electrocardiograms are shown for panels C and D.