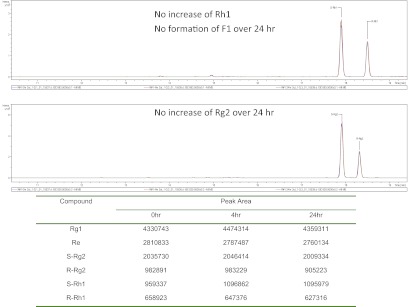
Fig. 3.
UPLC-TOF-MS chromatograms and peak areas of PPT-type secondary ginsenosides in the red ginseng extract incubated in gut bacteria collected from A/J mice at 0, 4, and 24 h. The top shows Rh1 and F1, and the bottom shows Rg2. The table underneath the chromatogram shows the peak areas of various compounds.

