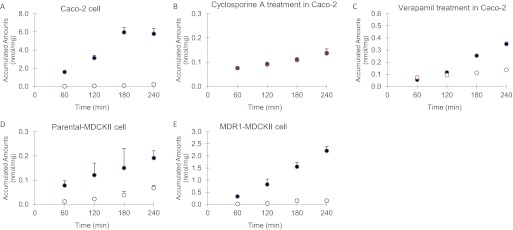
Fig. 4.
Transcellular transport of 2 μM C-K across monolayers of Caco-2, parental MDCKII, and MDR1-MDCKII cells: A, C-K transport alone; B, C-K transport with 20 μM cyclosporine A; C, C-K transport with 50 μM verapamil; D, 2 μM C-K transport in parental MDCKII cells; E, 2 μM C-K transport in MDR1-MDCKII cells. Transport from A to B is represented by ○ and that from B to A is represented by ●. Data are presented as mean ± S.D. (n = 3).

