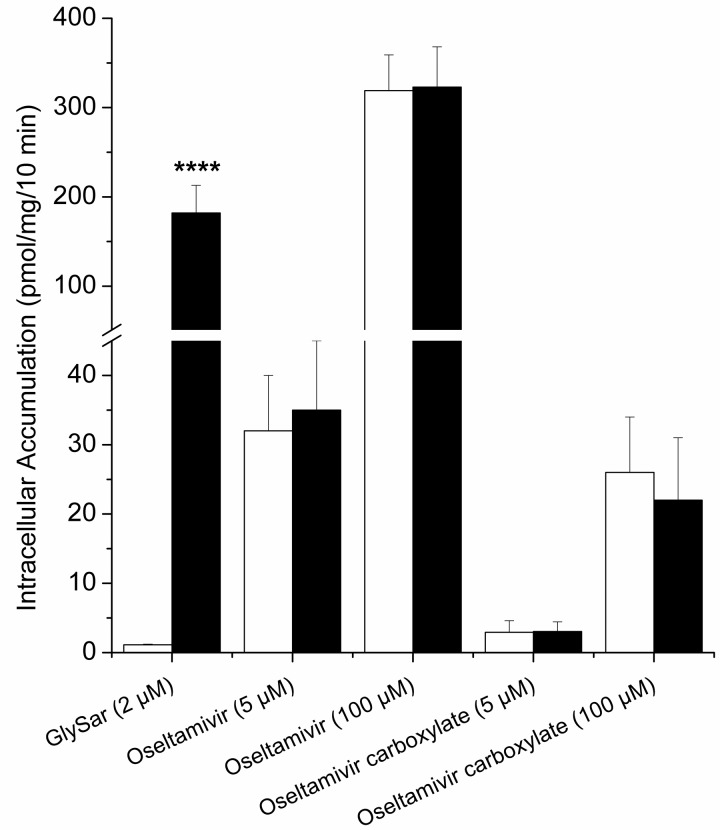
Fig. 1.
Gly-Sar, oseltamivir, and oseltamivir carboxylate intracellular accumulation in CHO-K1 cells (white bars) and CHO-PEPT1 cells (black bars) after a 10-min incubation at 37°C, pH 6. Values are mean ± S.D. of three independent experiments (except Gly-Sar, n = 6). Statistical analysis was performed on intracellular accumulation; data for CHO-K1 cells were compared with those for CHO-PEPT1 cells. ****, p < 0.0001.

