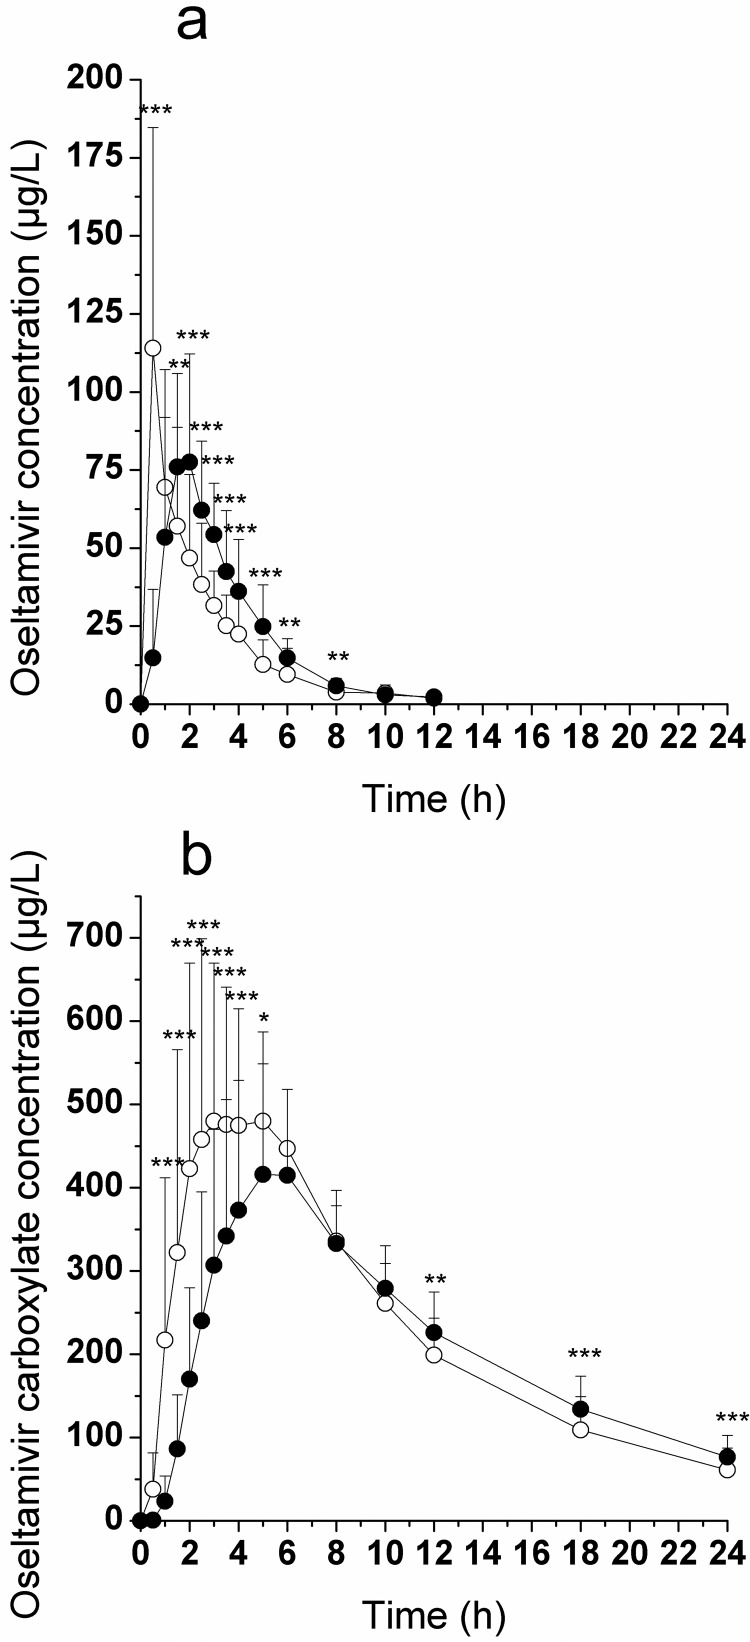
Fig. 7.
Mean plasma concentration-time profiles of oseltamivir (a) and oseltamivir carboxylate (b) after a single oral dose of oseltamivir (150 mg) to healthy volunteers before (open circles) and after (closed circles) a standardized high-fat and high-calorie breakfast. Values are mean ± S.D. (n = 18). Asterisks indicate a significant difference between treatments: *, p < 0.05; **, p < 0.01; ***, p < 0.001.

