Fig. 1.
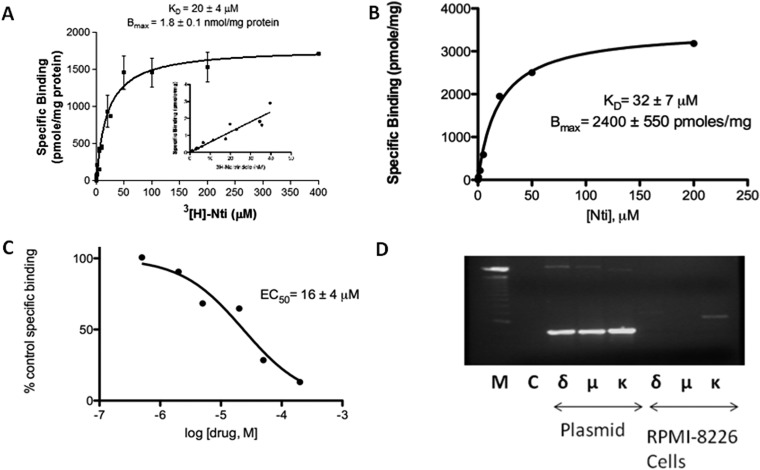
Naltrindole binding sites in human U266 and RPMI 8226 multiple myeloma cells. A, saturation curve of [3H]naltrindole binding to human U266 multiple myeloma cells derived from homologous competitive binding analysis as described under Materials and Methods. The inset displays the linear increase in [3H]naltrindole-specific binding using radioligand concentrations ranging from 1 to 40 nM. The KD for [3H]naltrindole was 20 μM, and the Bmax for U266 cells was 1.8 nmol/mg protein. B and C, saturation curves derived from homologous competitive binding analysis of naltrindole displacement of [3H]naltrindole binding using the radioligand at 10 nM and RPMI 8226 cells. B, specific binding. C, percentage of control specific binding. D, lack of evidence for the expression of δ-, μ-, and κ-opioid receptor mRNA in human RPMI 8226 multiple myeloma cells. RNA was isolated from human RPMI 8226 cells and amplified by RT-PCR using selective opioid receptor primer pairs. Twenty five cycles of PCR were conducted and analyzed on 1.2% agarose gels, after staining with 1 μg/ml ethidium bromide. Lane M, size marker DNA standards (the prominent midgel DNA standard is 1000 bp). Lane C, RT-PCR that lacked the Thermoscript reverse transcriptase as a negative control. For plasmid, lanes labeled δ, μ, and κ were positive controls in which 1 ng each of the human opioid receptor plasmids were used as PCR templates. For RPMI 8226 cells, lanes labeled δ, μ, and κ correspond to opioid receptor RT-PCR products derived from amplification of RNA isolated from human RPMI 8226 cells using receptor-selective primer pairs. Data are derived from three or more independent experiments.

