Fig. 1.
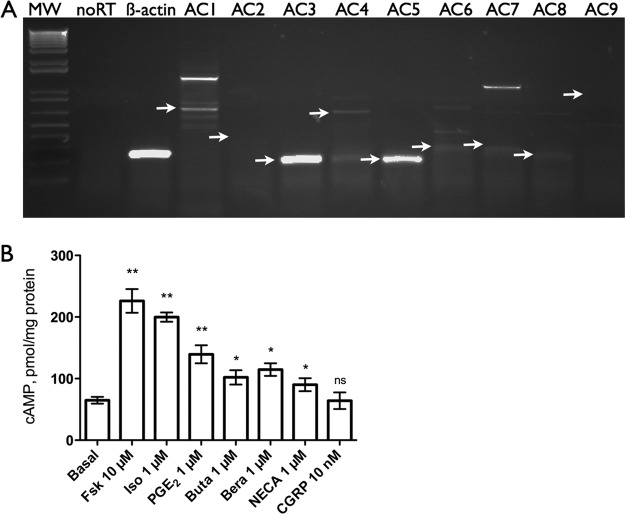
A, AC isoform mRNA expression in mBSMCs was measured by RT-PCR. AC isoform-specific primer pairs were used with 35 cycles of RT-PCR (see Materials and Methods). Representative images of three experiments are shown. Arrows indicate expected sizes of PCR product. Molecular weight markers (MW) are shown in the first lane. β-Actin primers were used with no reverse transcriptase (noRT) or cDNA (β-actin) templates. B, cAMP accumulation in whole cells pretreated with IBMX was measured (see Materials and Methods) in response to various agonists known to stimulate AC activity in other cells. Data are presented as mean ± S.E.M. (n = 3–4). *, p < 0.05; **, p > 0.01 by paired t test compared with basal (no drug). Fsk, forskolin; Iso, isoproterenol; Buta, butaprost; Bera, beraprost;NECA, adenosine-5′N-ethylcarboxamide; CGRP, calcitonin gene-related peptide.

