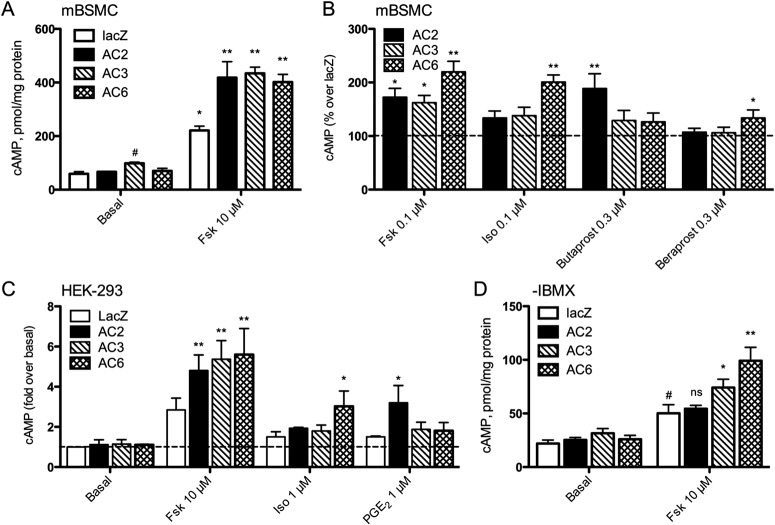
Fig. 4.
cAMP accumulation in mBSMC or HEK-293 cells expressing AC2, AC3, or AC6. mBSMCs (A, B, and D) or HEK-293 cells (C) were incubated with recombinant adenoviruses expressing either lacZ (control), AC2, AC3, or AC6, then cAMP production was measured (see Materials and Methods) A, mBSMCs were stimulated with a maximal concentration of forskolin (Fsk) in the presence of IBMX. *, p < 0.05; **, p > 0.01 by paired t test compared with basal. #, p < 0.05 by paired t test compared with lacZ condition. B, mBSMCs were treated with 0.1 μM Fsk, 0.1 μM isoproterenol, 0.3 μM butaprost, or 0.3 μM beraprost in the presence of IBMX. Data are presented as the percentage increase in cAMP levels when an AC was expressed over the lacZ condition, with the dashed line indicating no increase over lacZ. *, p < 0.05; **, p > 0.01 by paired t test compared with lacZ. C, HEK-293 cells were treated with vehicle, 10 μM Fsk, 1 μM Iso, or 1 μM PGE2. Data are presented as the fold increase in basal cAMP levels (vehicle-treated lacZ cells), with the dashed line indicating no increase over basal. *, p < 0.05; **, p > 0.01 by paired t test compared with lacZ. D, mBSMCs treated with a maximal concentration of Fsk or vehicle without the inclusion of a PDE inhibitor. *, p < 0.05; **, p > 0.01 by paired t test compared with lacZ. #, p < 0.05 by paired t test compared with basal. ns, not significant. All data are presented as mean ± S.E.M. (n = 3–5).

