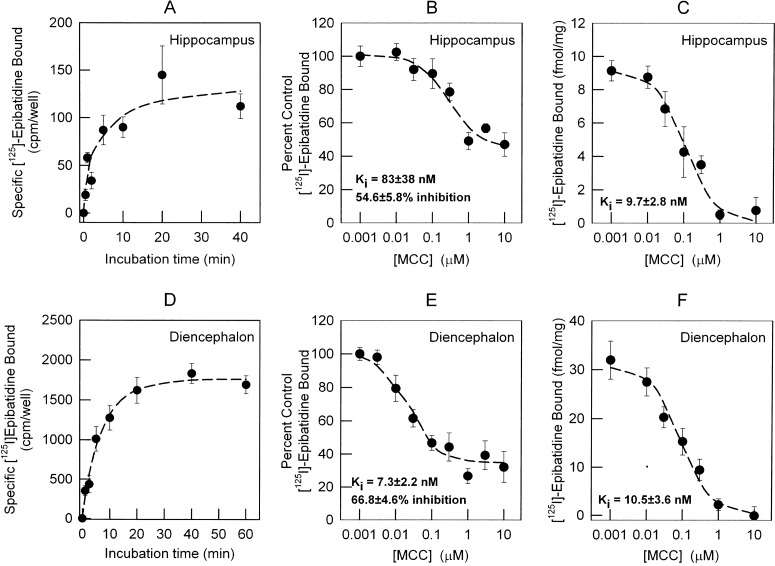
Fig. 4.
Measurement of the time course for [125I]epibatidine binding and comparison of MCC inhibition of [125I]epibatidine binding in whole cells and cell membranes. A and D, the time courses for the binding of [125I]epibatidine to intact neuronal cultures from hippocampus (A) and diencephalon (D) were measured by incubating the cells with 200 pM [125I]epibatidine for the times indicated. Neurons (12–14 days) were seeded in 48-well plates and assayed for [125I]epibatidine binding in the same culture dish at room temperature (22°C). Nonspecific binding was determined by including 100 μM nicotine in the binding reaction. The inhibition of [125I]epibatidine binding by MCC in intact neurons was measured by adding the indicated concentrations of MCC (0.001–10 μM) to the incubation medium. B and E, IC50 values and residual binding for both hippocampus (B) and diencephalon (E) neuronal cultures were calculated as described under Materials and Methods. C and F, IC50 values for MCC in total membrane preparations from both hippocampus (C) and diencephalon (F) were calculated as described under Materials and Methods. Apparent Ki values were calculated by using the Cheng-Prussof equation (apparent KD for [125I]epibatidine binding in intact cells: 73 pM for hippocampus and 111 pM for diencephalon; apparent KD for membrane preparations: 25 pM). Data for the association kinetics represent the mean ± S.E.M. for four separate determinations. Data for binding in situ represent nine replicates from two independent experiments and are presented as percentage of specific binding in the absence of competitor. Binding in total membranes represents four replicates from two independent experiments and is presented as total specific binding normalized by protein concentration. All curves are least-squares fits of the data as described under Materials and Methods.

