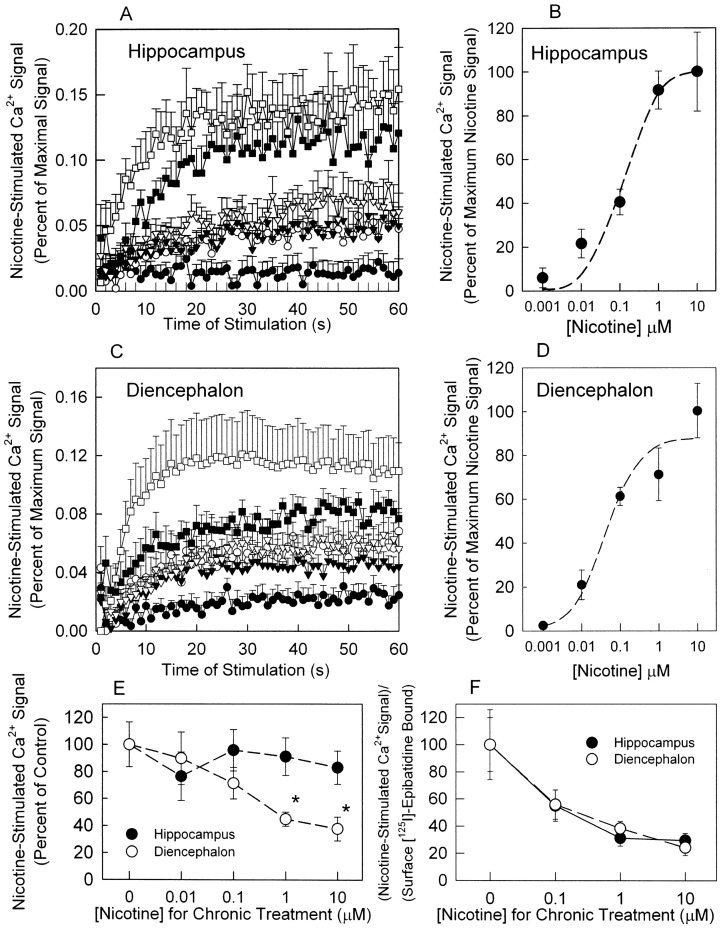
Fig. 6.
Intracellular Ca2+ determination in hippocampus and diencephalon neurons. A and C, time course of nicotine-induced Ca2+ influx in untreated hippocampus (A) and diencephalon (C) neurons cultured for 12 days was measured by using these nicotine concentrations: 0 μM (●), 0.001 μM (○), 0.01 μM (▾), 0.1 μM (▿), 1 μM (■), and 10 μM (□). Each point represents the mean ± S.E.M. for four separate experiments. B and D, concentration-response curves were calculated by using the area under the curve for each nicotine concentration, as shown in A and C, for hippocampus (B) and diencephalon (D) and using nonlinear least-squares to fit the curves as described under Materials and Methods. E, subsequently, neurons were chronically treated with 0.01, 0.1, 1, and 10 μM nicotine for 4 days and then assayed for Ca2+ influx stimulated with 10 μM nicotine. Results are presented as the percentage of the response measured for samples treated with 0 μM nicotine. F, the ratio of nicotine-stimulated increases in intracellular Ca2+ normalized by the percentage of surface binding after chronic nicotine treatment (data from E) divided by the amount of surface [125I]epibatidine binding measured after the same nicotine treatment (shown in Fig. 5, A and B). Data represented as mean ± S.E.M. of three independent experiments (n = 3–4 each). Significant statistical differences were found by Kruskal-Wallis ANOVA test, post hoc Dunn's method. *, p < 0.05.

