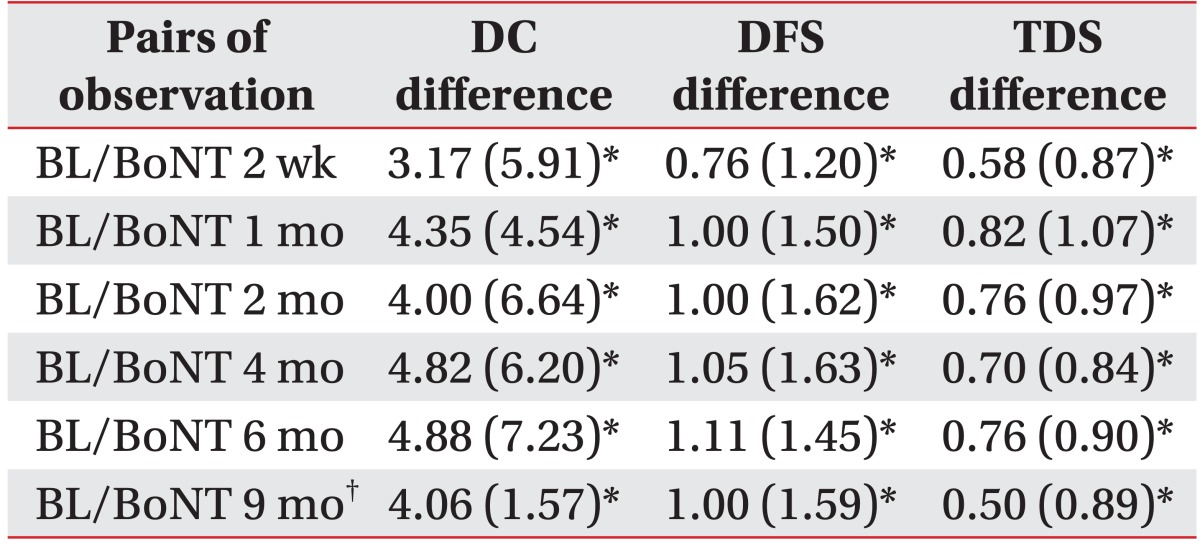
Table 2.
Mean Differences between Baseline and Follow-up Measurements
Values are mean (standard deviation)
BL: Baseline scores before botulinum toxin A injection, DC: Drool count, DFS: Drooling Frequency and Severity Scale, TDS: Teacher Drooling Scale
*p<0.05, †The last result of the patient who had received percutaneous endoscopic gastrostomy was excluded at 9 months

