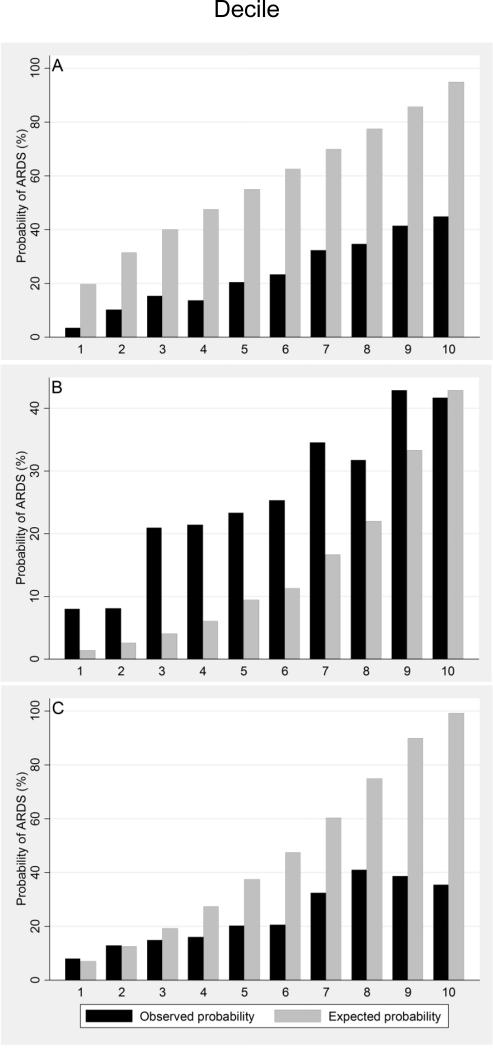
Figure 3.
Calibration plots of observed (black) and expected (gray) probabilities of ARDS across equally-sized deciles of predicted ARDS risk in the validation cohort (deciles 1-10 represent a continuum of lowest to highest predicted risk). Presented calibration plots are specific to the new ARDS prediction model (panel A), and those developed by Miller et al. (Panel B) and Navarrete-Navarro et al. (Panel C).

