
Figure 2.
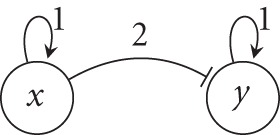
An instantiated interaction graph where Sx = {0, 1, 2} and Sy = {0, 1}. An activator is represented by an ordinary arrow; an inhibitor is represented with a blunt arrow.
Official websites use .gov
A
.gov website belongs to an official
government organization in the United States.
Secure .gov websites use HTTPS
A lock (
) or https:// means you've safely
connected to the .gov website. Share sensitive
information only on official, secure websites.
An instantiated interaction graph where Sx = {0, 1, 2} and Sy = {0, 1}. An activator is represented by an ordinary arrow; an inhibitor is represented with a blunt arrow.