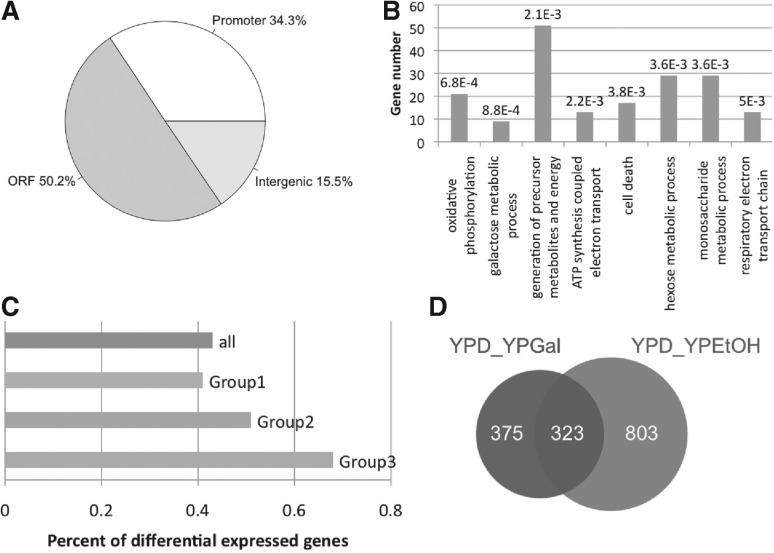
Fig. 4.
Identified RDNPs are related to transcriptional regulation. (A) Genomic distribution of the identified RDNPs. (B) Enriched GO terms (biological process) among the genes that are proximal to the RDNPs. The Benjamini adjusted P-value is listed above each bar. (C) Percentage of genes surrounding the RDNPs with differential gene expression. The group ‘all’ includes the genes that are proximal to all of the identified RDNPs. Group 1 includes the genes that are proximal to RDNPs that have an effective width shorter than 400 bp, Group 2 includes the genes proximal to RDNPs that have an effective width longer than 400 bp but shorter than 700 bp and Group 3 includes genes proximal to RDNPs that have an effective width longer than 700 bp. (D) Venn diagram of the RDNPs obtained for the YPD_YPGal pair and RDNPs obtained for the YPD_YPEtOH pair

