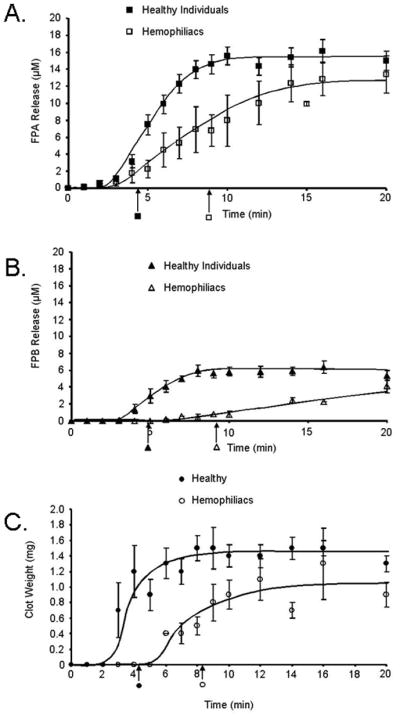
Figure 3. Comparison of fibrinopeptide release and fibrin mass in normal and hemophilia whole blood.

Contact pathway inhibited whole blood was initiated to clot upon addition of 5 pM tissue factor and analyzed for: A) fibrinopeptide A (FPA) release as a function of time in healthy (■) and hemophilia whole blood (□); B) fibrinopeptide B (FPB) release as a function of time in healthy (▲) and hemophilia whole blood (△); C) fibrin mass (clot weights) at each time point in 1 mL of healthy (●) and hemophilia (○) whole blood. All data are shown as the mean±SEM. Clot time is shown below the x-axis as an arrow.
