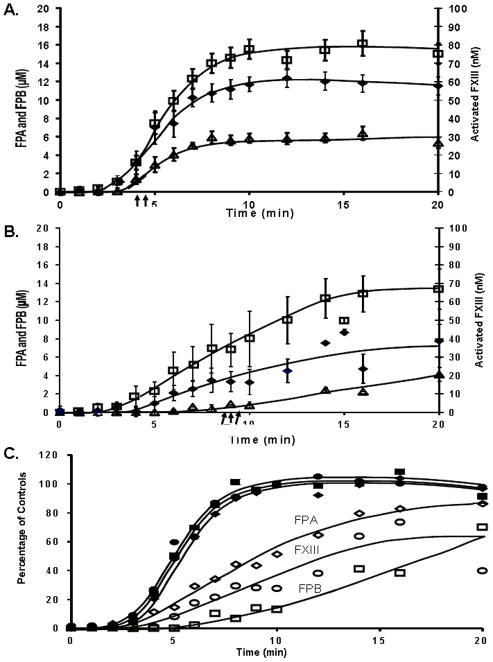
Figure 4. Correlative patterns of fibrinopeptide release and FXIII activation.
Fibrinopeptide A (FPA, □) and fibrinopeptide B (FPB, △) release is compared with FXIII activation (◆) for the quenched time points (0–20 minutes) in contact pathway suppressed healthy (panel A) and hemophilia A and B blood (panel B). Data are shown as the mean±SEM with the clot time shown as an arrow below the x-axis. Panel C. Maximum values for the control data for FPA, FPB and FXIII was determined and each time point for controls (closed symbols) and hemophiliacs (open symbols) and was replotted as a percentage of the maximum values.

