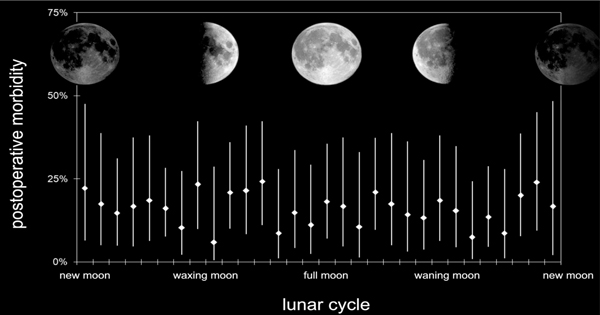
Figure 1.

Rate of postoperative complications in % on each day of the lunar cycle when initial surgery took place. Rhombi indicate means of morbidity, whereas vertical lines show 95% CIs. Broad overlapping CIs indicate that there was no statistical difference between each day of lunar cycle (Chi-Square test: P = .846).
