
Figure 7.
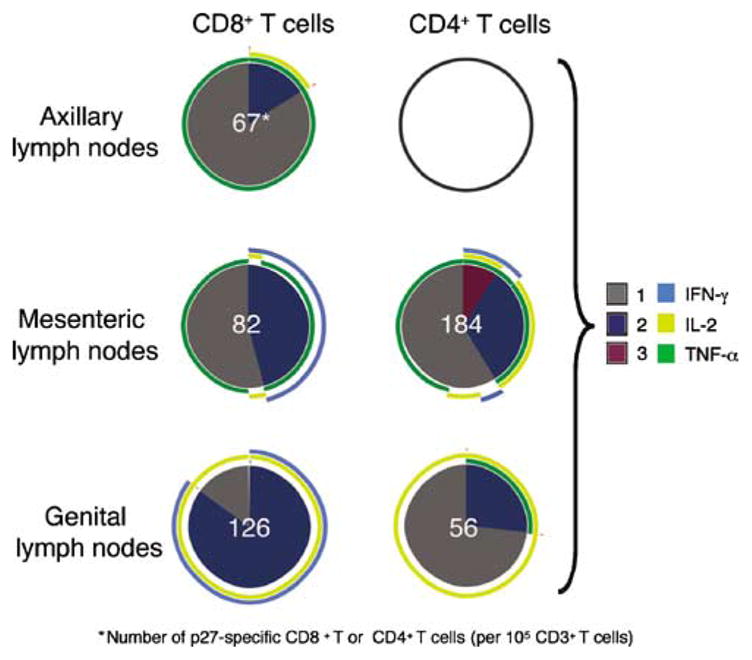
Frequency and distribution of Gag CM9-specific T cells in systemic tissues 6 months post-SHIV89.6 immunization. SIV-specific CD8 + and CD4 + T-cell responses in cryopreserved axillary, mesenteric, and genital lymph node mononuclear cell samples from the Mamu-A*01-positive animal (30851) are shown as a pie chart (PBMC samples were not analyzed because the number of events collected was three times lower in the p27-stimulated tube relative to the background tube). An empty circle indicates lack of a positive response in that T-cell subset. The frequency of positive SIV-specific T cells normalized to 105 CD3 + T cells is shown for each individual response as a white number in the center of the pie chart. Each portion of a pie chart indicates the percentage of SIV-specific T cells that responded with one, two, or three functions, and the arcs around the pie show the function or combination of functions to which the specific response corresponds (see color legend). *Number of p27-specific CD8 + or CD4+ T cells (per 105 CD3 + T cells). IFN-γ, interferon γ; IL-2, interleukin 2; PBMC, peripheral blood mononuclear cell; SHIV, simian–human immunodeficiency virus; SIV, simian immunodeficiency virus; TNF-α, tumor necrosis factor-α.