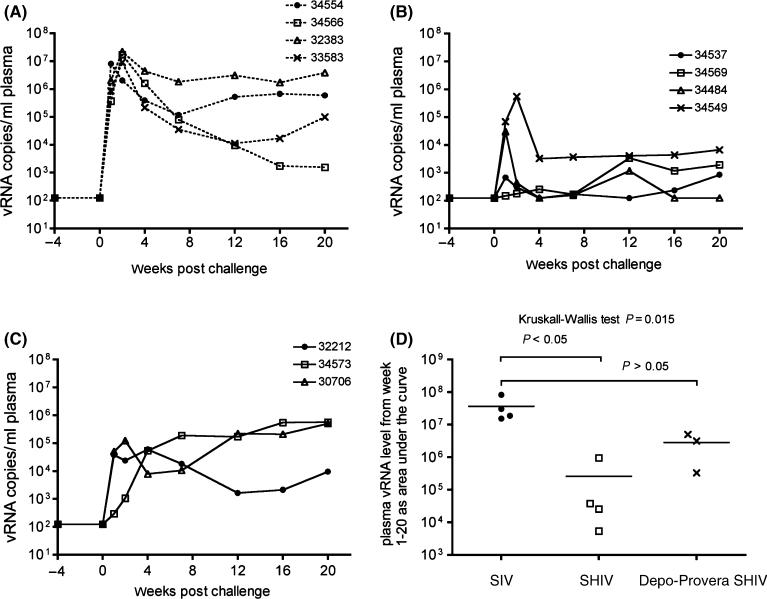
Fig. 1.
Plasma viral RNA (vRNA) levels after intravenous SIVmac239 challenge. (A) SIV control macaques, (B) SHIV macaques and (C) Depo-Provera SHIV macaques. In panel D, the vRNA levels over the entire 20 weeks of follow up were transformed into areas under the curve (AUC) and the mean AUC of the three groups of animals were compared using a Kruskall–Wallis test and then a pair-wise comparison between the groups of immunized animals and the control group was performed using Dunn's multiple comparisons test. P-values are noted in the Figure.

