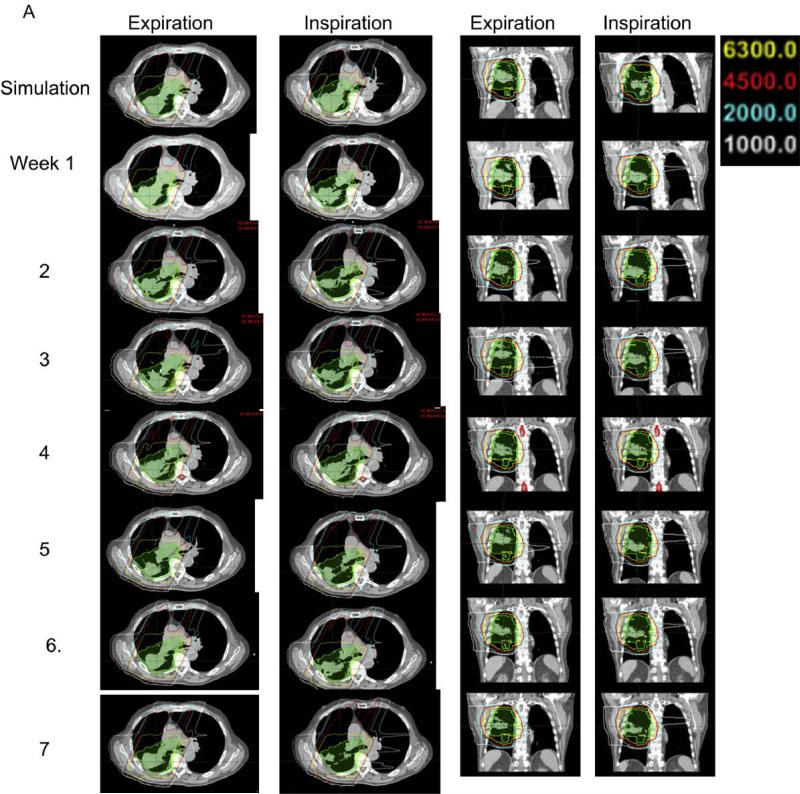
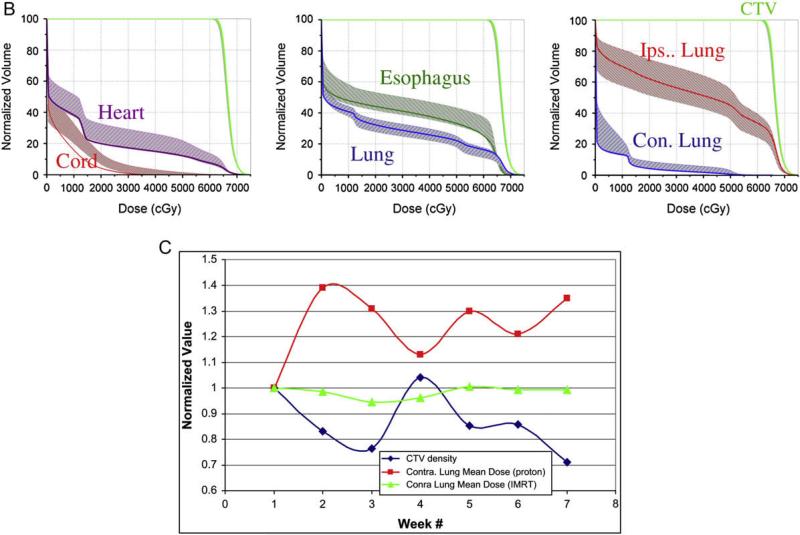
Fig. 1.
Isodose distribution, dose volume and density changes in a typical case during 7 weeks of radiation therapy. (A). The dose distributions in transverse and sagittal planes of the planning computed tomography (CT) scan and seven weekly repeated CT scans in the end-expiration and end-inspiration phases. (B) Dose–volume histograms (DVH) of the clinical target volume (CTV) and normal tissues and their variation (DVH variation band shown as shaded region) over 7 weeks of repeated four-dimensional CT plans. (C) Changes in CTV density correlated inversely with increased contralateral lung mean dose over 7 weeks in proton therapy planning but not in intensity-modulated radiation (photon) therapy planning.


