
Figure 3.
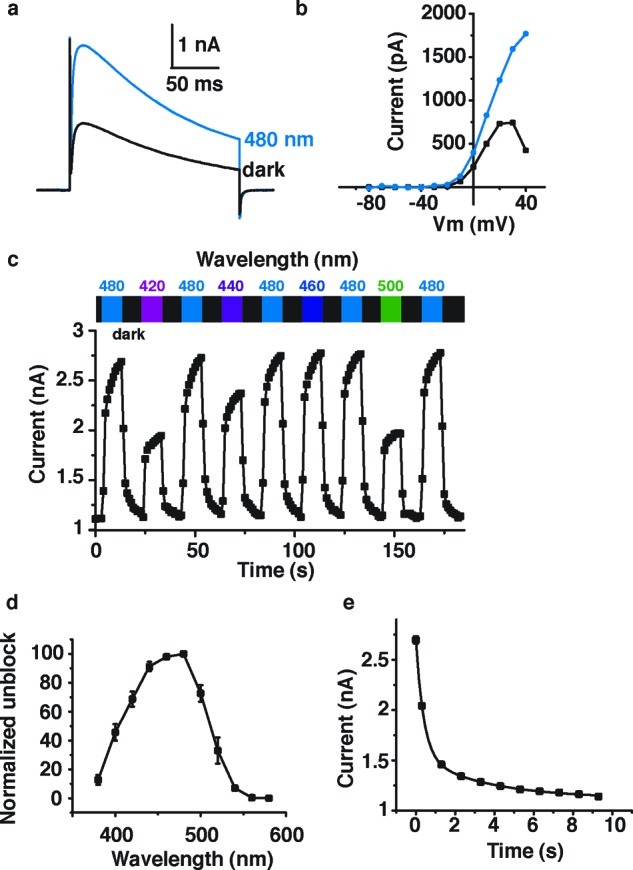
Effect of DENAQ on Kv3.1 expressed in HEK293 cells. (a) Cells were treated with 100 μM DENAQ. Kv current was measured in whole cell mode using a 200 ms depolarization from −60 to +40 mV, in the dark and under 480 nm light. Capacitive currents have been cut off for clarity. (b) Membrane-voltage dependence of block and unblock. Steady-state current (at the end of the 200 ms depolarization) is plotted as a function of membrane potential. (c) Reversibility of photoswitching and action spectrum of DENAQ on Kv3.1. Potassium current was measured using the protocol described in (a) looped at 1 Hz. Peak current is plotted as a function of time. Cycles of dark and illumination (420–500 nm) are indicated. (d) Unblock as a function of wavelength. Unblock was normalized to 100% for 480 nm light (n = 3–4 cells). (e) Apparent thermal relaxation rate of DENAQ measured by electrophysiology. Kv3.1 peak current is plotted as function of time after light is switched off. Four light-dark cycles are averaged for this single cell. Data points were fitted with a biexponential decay equation: y = y0 + A1 exp(−x/τ1) + A2 exp(−x/τ2) with y0 = 1122 ± 23 pA, A1 = 1148 ± 59 pA, τ1 = 392 ± 37 ms, A2 = 422 ± 39 pA, and τ2 = 3.5 ± 0.8 s.