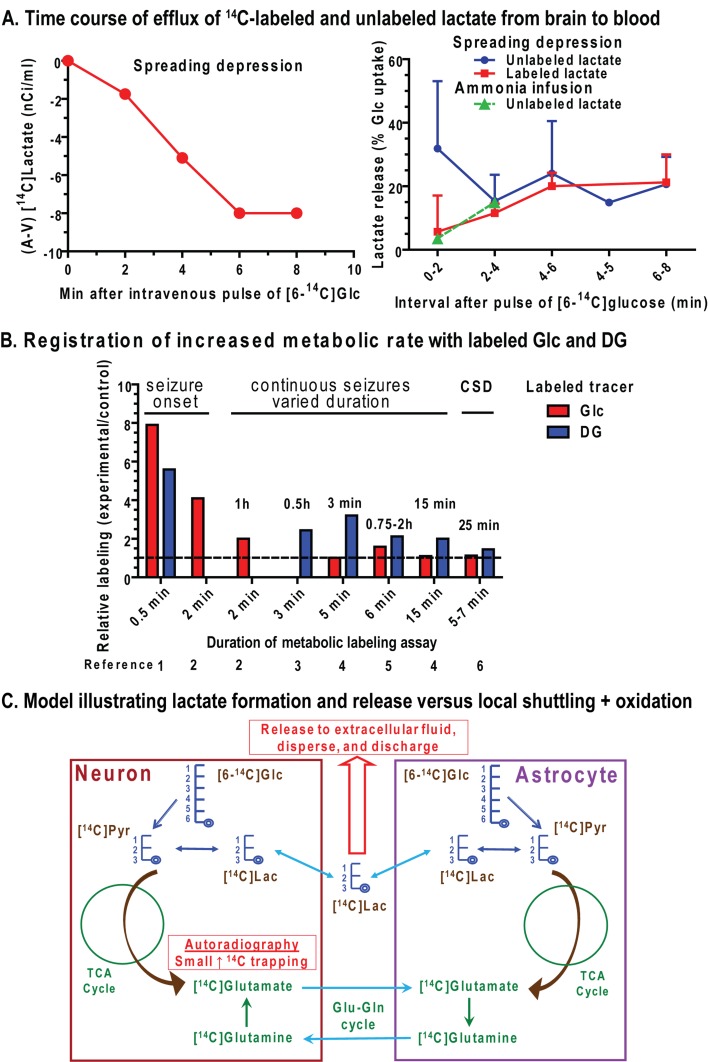
Figure 5. Lactate efflux from brain and dependence of underestimation of metabolic activation with [14C]glucose on duration of labelling assay.
(A) Left panel: time course of release of [14C]lactate from brain at intervals after pulse labelling with [6-14C]glucose during bilateral cortical spreading depression. Each point represents the a–v difference during a 2-min sampling interval plotted at the time of the end of the interval. Lactate was the predominant labelled compound released to blood; release of 14C-labelled amino acids and 14CO2 into venous blood was very low and slow (not shown). Reprinted by permission from Macmillan Publishers Ltd: (J Cereb Blood Flow Metab] (Cruz NF, Adachi K, Dienel GA (1999), Rapid efflux of lactate from cerebral cortex during K+ -induced spreading cortical depression., J Cereb Blood Flow Metab 19:380-392), copyright (1999). Right panel: time courses of release of labelled and unlabelled lactate from brain at intervals after pulse labelling during spreading cortical depression [reprinted by permission from Macmillan Publishers Ltd: (J Cereb Blood Flow Metab) (Cruz NF, Adachi K, Dienel GA (1999), Rapid efflux of lactate from cerebral cortex during K+ -induced spreading cortical depression., J Cereb Blood Flow Metab 19:380-392), copyright (1999)] or after an acute intravenous ammonia injection where the values plotted at 2–4 min are actually at 4–5 min (data from Hawkins et al., (1973). Values are expressed as percentage of glucose entering the brain in the same a–v sample pair. (B) Labelled glucose registers large increases in metabolic activation with very short (0.2–2 min), but not longer (5–15 min) assay intervals. Data are expressed relative to the control value in each study. Duration of seizures or CSD (cortical spreading depression) is indicated above the respective data sets. Data are from the following references: (1) (Miller et al., 1982); (2) (Borgstrom et al., 1976); (3) (Cremer et al., 1988); (4) (Van den Berg and Bruntink, 1983); (5) (Ackermann and Lear, 1989); (6) (Adachi et al., 1995). (C) Glucose is metabolized in neurons and astrocytes, and autoradiographic studies indicate that a large fraction of the label derived from glucose is not retained in the cell (Figure 4). If lactate were produced by either neurons or astrocytes and shuttled to another cell where it is oxidized, the label should be diluted into the large amino acid pools due to the action of the MAS (Figure 1) and trapped in the activated tissue. Lack of trapping indicates rapid release of labelled metabolites, mainly lactate. Reprinted from Neurochem Int, 45, Dienel GA and Cruz NF, Nutrition during brain activation: does cell-to-cell lactate shuttling contribute significantly to sweet and sour food for thought? 321–351, Copyright (2004), with permission from Elsevier.

