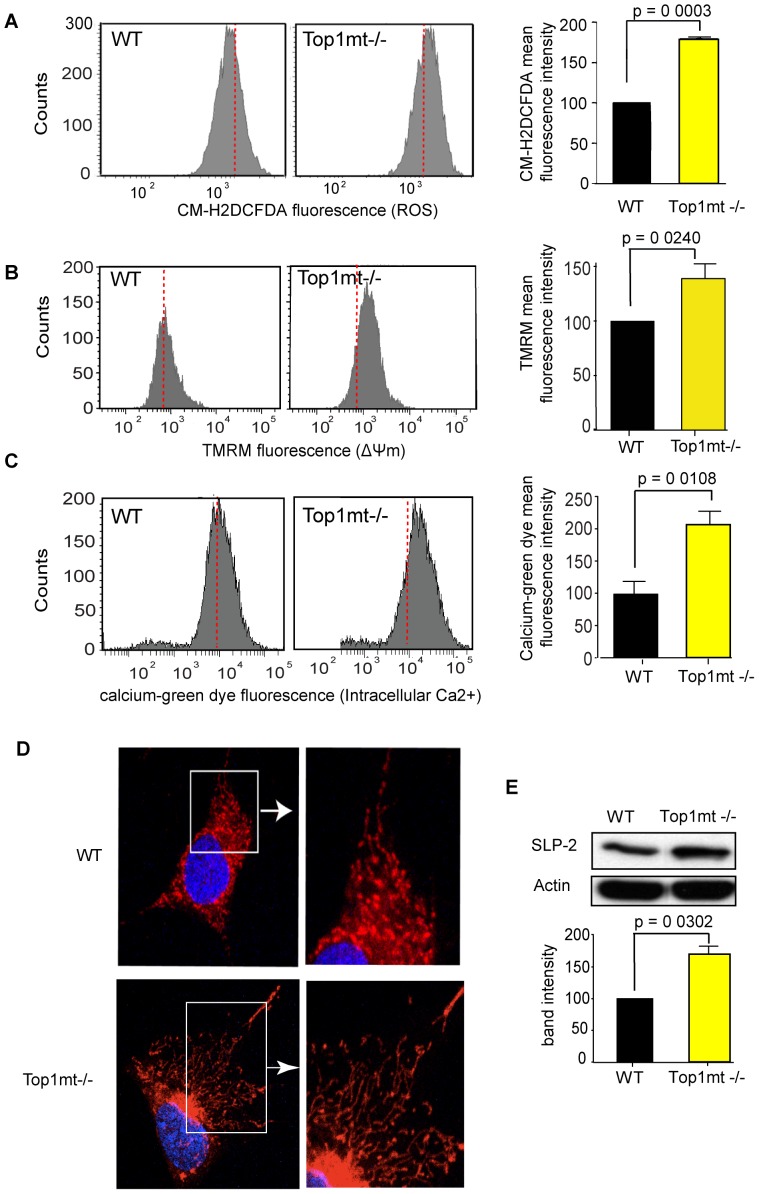
Figure 1. Mitochondrial dysfunction in Top1mt−/− cells.
FACS analysis of ROS (A), mitochondrial membrane potential (ΔΨm) (B) and intracellular calcium content (C) in WT and Top1mt−/− cells. CM-H2DCFDA, TMRM and Calcium Green dye fluorescence were plotted against cells numbers (count). Red line represents median of the histogram for WT samples. For each panel, quantification of mean fluorescence intensity is shown on the right referred as percentage of WT values. (D) Mitochondrial hyperfusion in Top1mt−/− cells visualized by mitotracker red staining. (E) SLP-2 (Stomatin like protein 2) expression by Western-blot (cropped figure) in WT and Top1mt−/− cells. Right plots represent means ± standard deviations of at least 3 experiments (quantification from 3 independent determinations).

