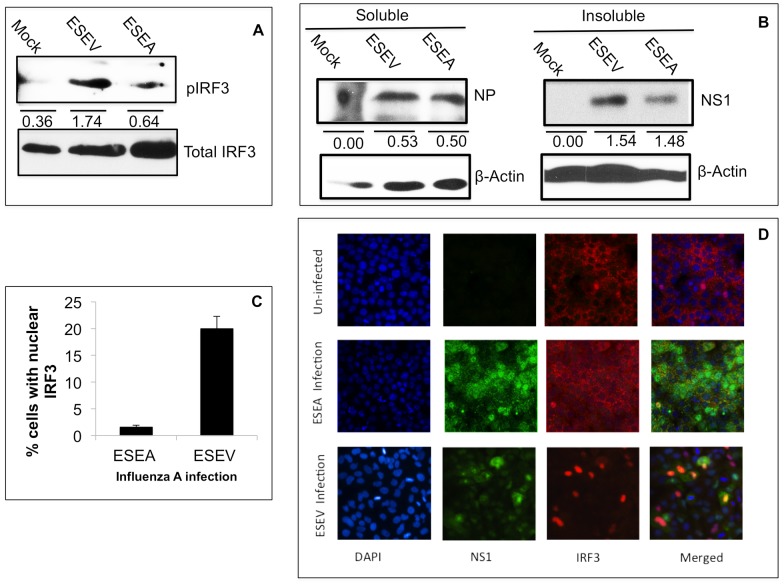
Figure 8. ESEV PBM impairs activation of IRF3 during infection.
A). A549 cells were infected at an m.o.i. of 1 with an H3N2 influenza A virus that expresses either an H6N6 NS1protein with the wt ESEV PBM or mutant ESEA PBM virus. Cell lysates were prepared at the 6 hours post-infection and phosphorylated and total IRF3 levels were quantified in an immunoblot. Densitometry was performed with ImageJ software and the pIRF3 levels were normalized to total IRF3. B. A549 cells were infected with indicated viruses and at 6 hours post-infection cell lysates were prepared and separated into soluble and insoluble fractions as described in Materials and Methods; levels of viral NP and NS1 proteins in cell fractions were quantified with ImageJ software and normalized to β-actin levels in the corresponding sample. C) A549 cells were infected an m.o.i. of 1 with an H3N2 influenza A virus that expresses either an H6N6 NS1protein with the wt ESEV PBM or mutant ESEA PBM virus. Percentages of cells with nuclear localized-IRF3 were quantified by manually counting as described in Materials and Methods for three independent experiments. A minimum 200 cells were examined to quantify IRF3 nuclear localization. Error bars represent the standard error of the mean. Statistical difference in effects of NS1 plasmids was determined by student t-test in all the experiments. D). A representative immunofluorescence images used for quantitation in panel C is shown.

