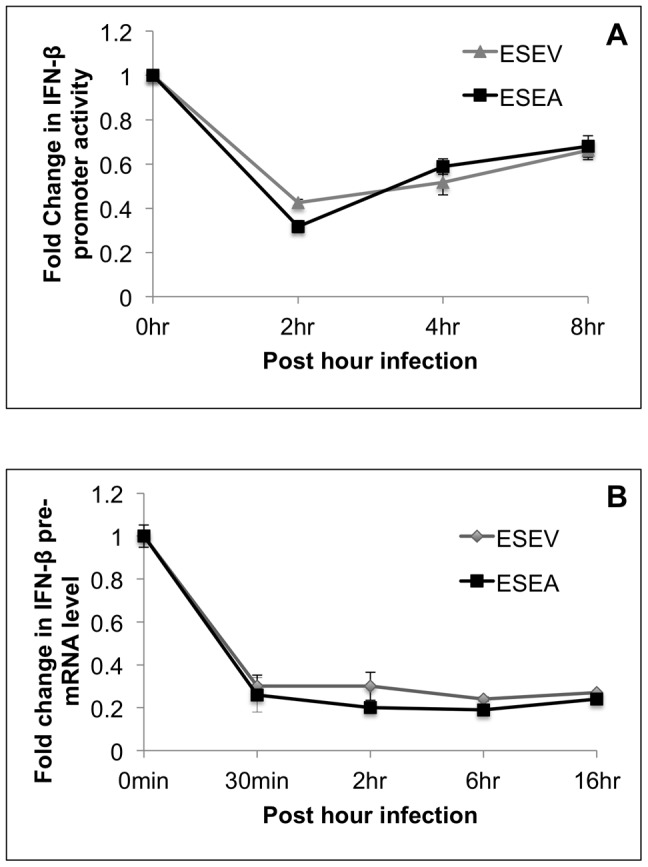
Figure 9. Effects of NS1 ESEA PBM on activation of IRF3 and IFN-β pre-mRNA levels during influenza A infection.

A) A549 cells were transfected with IFN-β Luciferase and Renilla Luciferase plasmids. After 24 hours, cells were infected with wt or ESEA virus at an m.o.i. of 1.0. Samples were collected at the indicated times for Luciferase assays. IFN-β luciferase values were normalized to Renilla Luciferase. Error bars represent the standard error of the mean. B) A549 cells were infected with either wt or ESEA virus at an m.o.i. of 1.0. Total RNA was isolated at the indicated times post-infection and RT-PCR assays were performed for IFN-β pre-mRNA as described in Methods. IFN-β pre-mRNA levels were normalized to GAPDH mRNA levels. Error bars represent the standard error of the mean.
