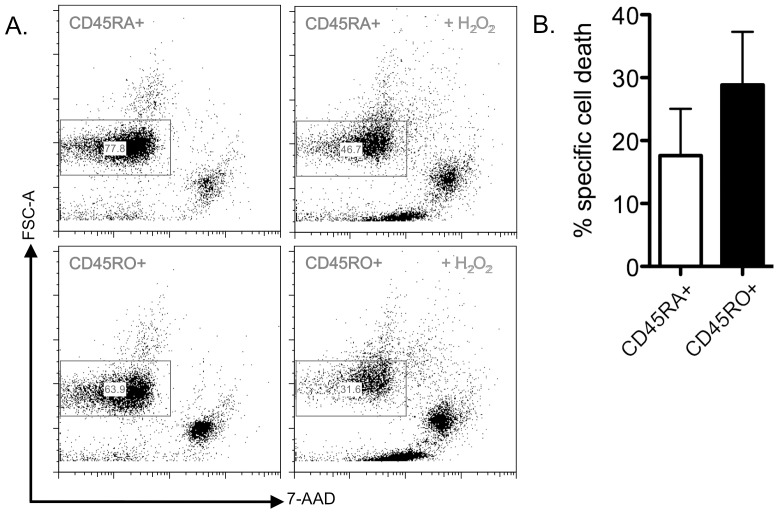
Figure 1. Representative cell viability in response to treatment with low doses of H2O2.
A. Representative FACS data for untreated vs. H2O2-exposed (5 µM} T cell subsets isolated from one healthy donor are shown. Cell viability (gate) was assessed by changes of the forward scatter (FSC-A) profile and staining with 7-AAD.. B. Mean values for specific H2O2-induced cell death are shown (n = 5). Bars represent the standard error mean.

