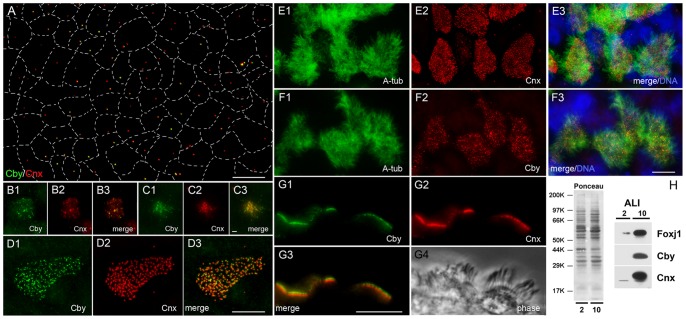
Figure 9. Cby and Cnx in differentiating mouse tracheal epithelial cells (mTECs).
A–G: mTECs of ALI-0 (A), ALI-2 (B–C), and ALI-10 (D to G) stained with Cby, Cnx, and acetylated α-tubulin antibodies. Merged images with DAPI are shown in E3 and F3, and G4 is a phase image. Dotted lines in A represent borders between adjacent cells. Bars, 1 µm (B–C) and 10 µm (A, D, E–G). H: Immunoblot analysis of ALI-2 and ALI-10 mTECs probed with Foxj1, Cby, and Cnx.

