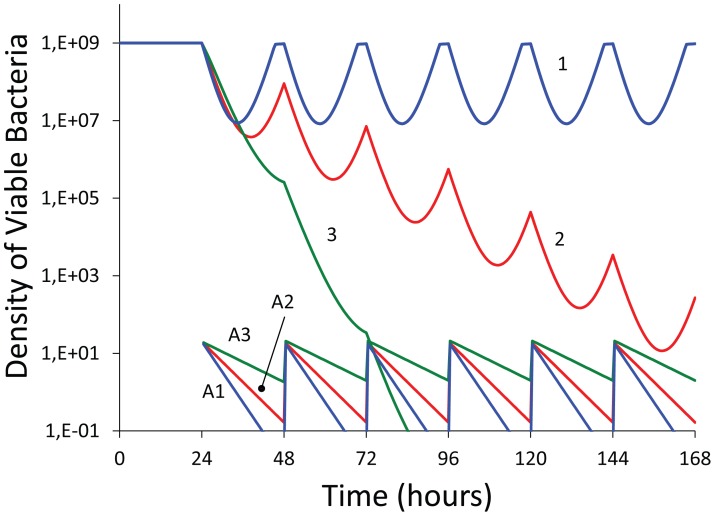
Figure 6. Simulation of antibiotic treatment of bacteria in continuous culture under optimal conditions, no biofilm or persister subpopulations with constant Hill function parameters; numerical solutions to the equations of the model used in [44].
Changes in antibiotic concentration (A1, A2 & A3) and viable cell density of planktonic bacteria (1, 2, and 3). In all simulations the maximum and minimum hourly growth/death rates are respectively, VMAX = 1, VMIN = −0.5, the Hill coefficient κ = 1.0 and the MIC = 2 mg L−1. Every 24 hours, 20 mg/L of the antibiotic was added and is the Peak concentration for all runs. The flow rates and PK/MIC ratios for the Time > MIC and AUC are respectively: For w = 0.3, 3.85 and 33.3; for w = 0.2, 5.75 and 49.6; and for w = 0.1, 11.5 and 90.9, The equations for calculating the PK element of these indices is noted in Appendix S1 under the assumption that the only source of decline in the concentration of the antibiotic is the flow rate, δ = w.

