Figure 6.

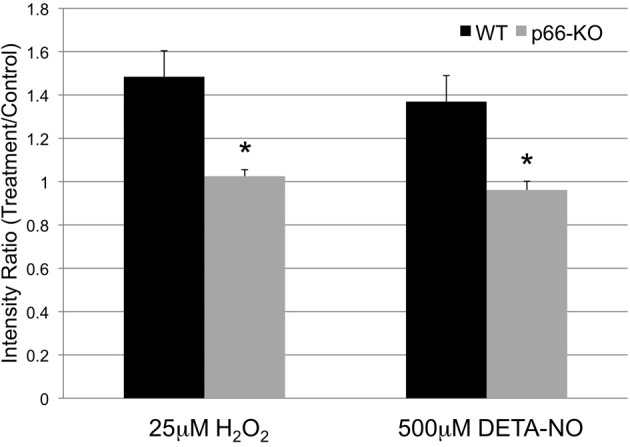
p66-KO neurons generate less ROS following exposure to oxidative stress. Week-old p66-KO and WT neurons were treated with either 25 μM H2O2, 500 μM DETA-NO, or control media for 1 h, and assessed for changes in mitochondrial ROS levels. Mitochondria were visualized with mito-GFP labeling, and mitochondrial ROS was visualized following Mitosox (a fluorescent reporter of mitochondrial superoxide) incubation. Following H2O2 treatment, p66-KO neurons showed significantly less increases in mitochondrial ROS levels compared to WT neurons (p66-KO = 1.03 ± 0.03X; WT = 1.48 ± 0.12X). Similarly, following DETA-NO treatment, p66-KO neurons showed significantly less increases in mitochondrial ROS levels compared to WT neurons (p66-KO = 0.96 ± 0.04X; WT = 1.37 ± 0.12X). (* = p < 0.05) (n = 10 images/treatment/genotype).
