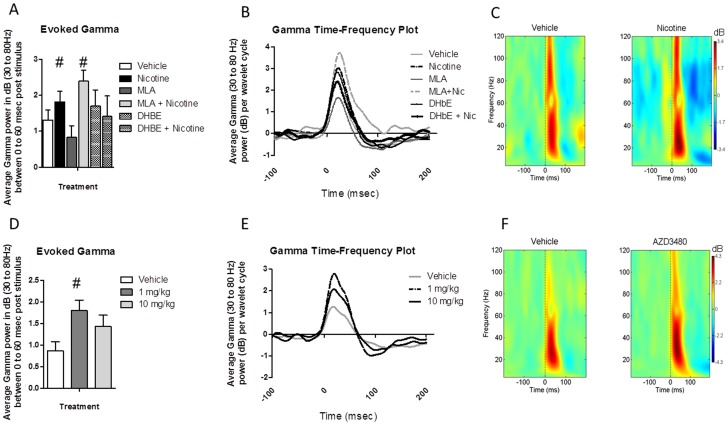
Figure 4. Nicotine receptor subtype-specific effects on auditory evoked gamma oscillations.
(Top) Event-related Gamma (30 to 80 Hz) activity following nicotine and nicotine receptor antagonists. Assessment of the effects of nicotine antagonists was carried out using a within subjects design in which each mouse was assessed on each drug, with sessions being separated by a 24 hour washout period. N = 13 for each condition. Depicted top left A) is the average event-related gamma power (in dB) for the period between 0 and 60 msec following stimulus onset, across all 50 stimulus presentations. This was done by calculating the time-frequency response for each wavelet cycle within the 0 to 60 msec period and averaging the resulting values to create a single number. All statistical analyses were conducted on these values. Nicotine (1 mg/kg) caused an increase in evoked gamma activity, which was blocked by DHβE (2 mg/kg) but not MLA (10 mg/kg), indicating that the positive effect of nicotine on gamma activity is mediated through the α4β2 receptor subtype. # indicates p<0.05. Top center B) depicts event-related gamma power across each individual wavelet cycle between 100 msec pre-stimulus and 200 msec post-stimulus across all 50 stimulus presentations. Depicted top left C) is a heat map showing event-related power in decibels (event-related spectral perturbation, i.e. the power following the stimulus expressed as a change from baseline) from 200 msec prior to stimulus onset to 200 msec post onset (0 = stimulus onset) across all 50 stimulus presentations following vehicle and nicotine treatment. (Bottom) Event-related Gamma activity following administration of the α4β2 specific agonist AZD3480. Assessment of the effects of AZD3480 was carried out using a within subjects design in which each mouse was assessed on each drug, with sessions being separated by a 72 hour washout period. The mice used to assess AZD3480 were a separate cohort from those shown in Figure 2A used to assess nicotine antagonists. N = 9 for each condition. Bottom left D) shows a significant increase in event-related gamma following low (1 mg/kg), but not high (10 mg/kg) dose AZD3480. The methodology used to create bottom left D), center E) and right F) figures are the same used to create figures A, B and C, respectively. # - indicates significant differences from saline vehicle (all p<0.05).

