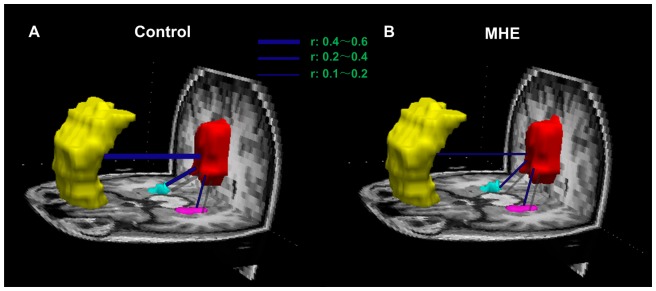
Figure 3. Functional connectivity within the DMN in healthy control and MHE patient groups.
Averaged temporal correlation coefficient r (Blue) across all subjects in the healthy control group (A) and in the MHE patient group (B). Compared with healthy controls, MHE patients show decreased temporal correlation coefficients between the PCC/PCUN and the MPFC, as well as between the PCC/PCUN and the left PHG. MPFC is color-coded yellow, PCC/PCUN color-coded red, the left PHG color-coded pink, the right PHG color-coded cyan. DMN = default mode network; MHE = minimal hepatic encephalopathy. PCC/PCUN = posterior cingulate cortex/precuneus; MPFC = medial prefrontal cortex; PHG = parahippocampal gyrus.

