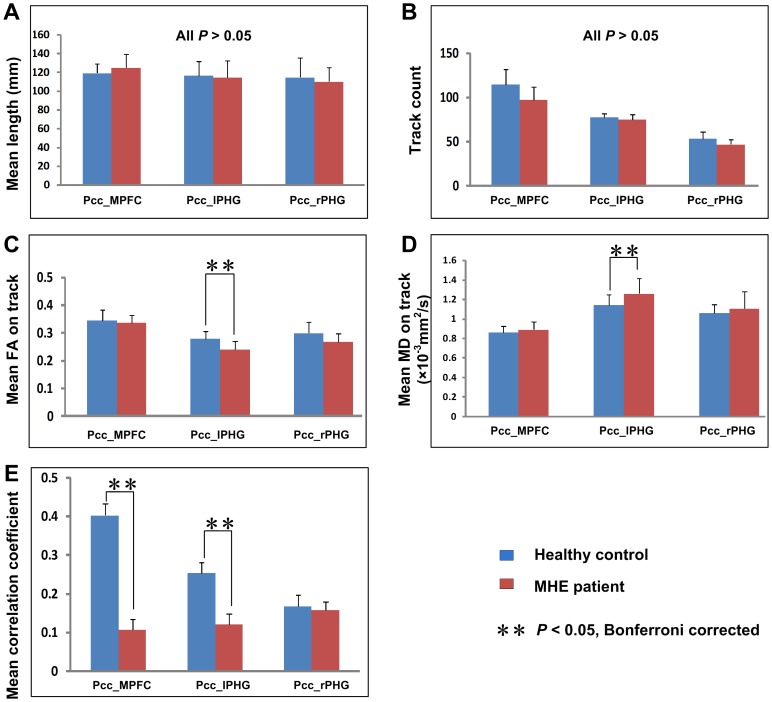
Figure 4. Comparison of structural and functional connectivity between MHE patients and healthy controls.
Compared to the healthy controls, MHE patients show both decreased FA and increased MD in the tract connecting the PCC/PCUN to left PHG, and decreased functional connectivity between the PCC/PCUN and left PHG, and MPFC. For each connection, differences are setting at the significant level of corrected P<0.05 (marked with **) with Bonferroni correction. Error bars represent the standard deviation of the measurements. MHE = minimal hepatic encephalopathy; PCC/PCUN = posterior cingulate cortex/precuneus; PHG = parahippocampal gyrus; MPFC = medial prefrontal cortex; FA = fractional anisotropy; MD = mean diffusivity.

