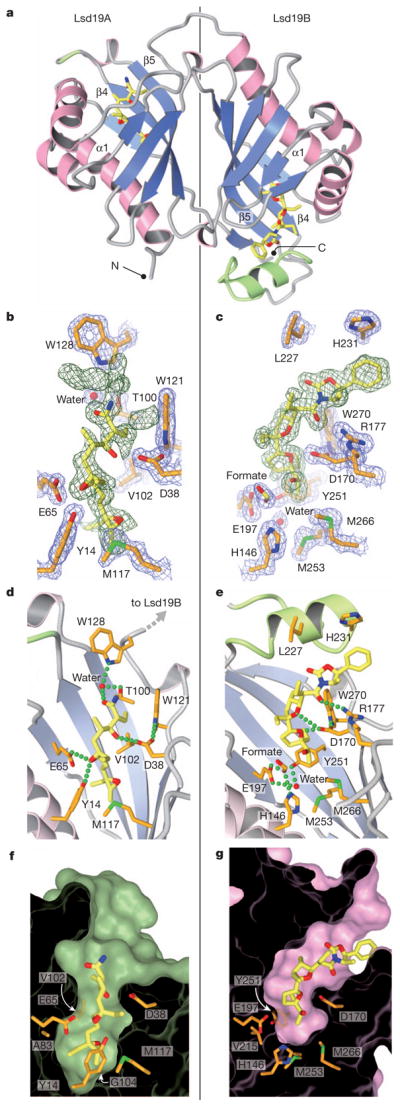
Figure 2. Crystal structure of Lsd19.

a, The overall fold of Lsd19. The extra loop–helix–loop in Lsd19B and the corresponding insertion site in Lsd19A are shown in green. b, c, Lsd19A (b) and Lsd19B (c) electron density for the ligand (simulated-annealing omit map contoured at 2.0σ, green mesh) and protein side chains (2Fo – Fc map contoured at 1.5σ, blue mesh). Carbon atoms of the bound ligands and protein are shown in yellow and orange, respectively. Oxygen, nitrogen and sulphur atoms are shown in red, blue and green, respectively. Green broken lines represent hydrogen bonds. d, e, Lsd19A (d) and Lsd19B (e) active-site hydrogen-bonding interactions between the ligand and protein side chains. The α1 helix (as labelled in panel a) was removed to clarify the view. f, g, Lsd19A (f) and Lsd19B (g) molecular surface cross-section, showing residues that determine the pocket size and shape.
