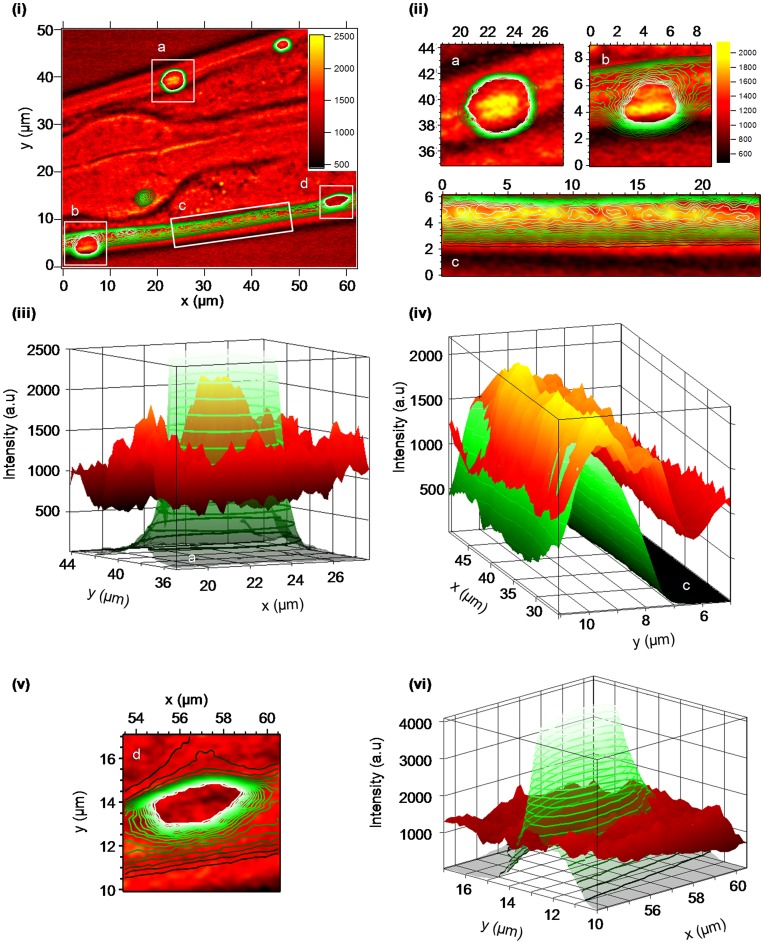
Figure 4. CARS and fluorescence microscopy images of the nematode, C. elegans (Q40-YFP) at 1 day old adult (day 4).
(i) Image of the lateral view obtained by CARS microscopy (1657 cm−1); where the CARS intensity (in arbitrary units) is shown by the scale bar and the fluorescence intensity is shown by green contours. Four regions are identified (a,b,c,d) which are shown in an expanded form in figures (ii) to (vi) (ii) Expanded view of regions a, b, c from figure (i) where the CARS signal (1657 cm−1) intensity is greatest. The axes are in microns and correspond to the axes shown in figure (i), other than for region ‘c’ which is rotated; the axes are in microns. (iii) Plot of the region identified as ‘a’ in figures (i) and (ii) against intensity (in arbitrary units). The fluorescence signal is identified in green/green contours and the CARS signal (1657 cm−1) black-red-yellow with a scale as in figure (ii). (iv) Plot of the region identified as ‘c’ in figures (i) and (ii) against intensity (in arbitrary units). Note: the rotation, the cuticle and hypodermis of the C. elegans nematode is to the right hand side of the figure, rather than at the bottom of the figure as in (ii) expanded view ‘c’.

