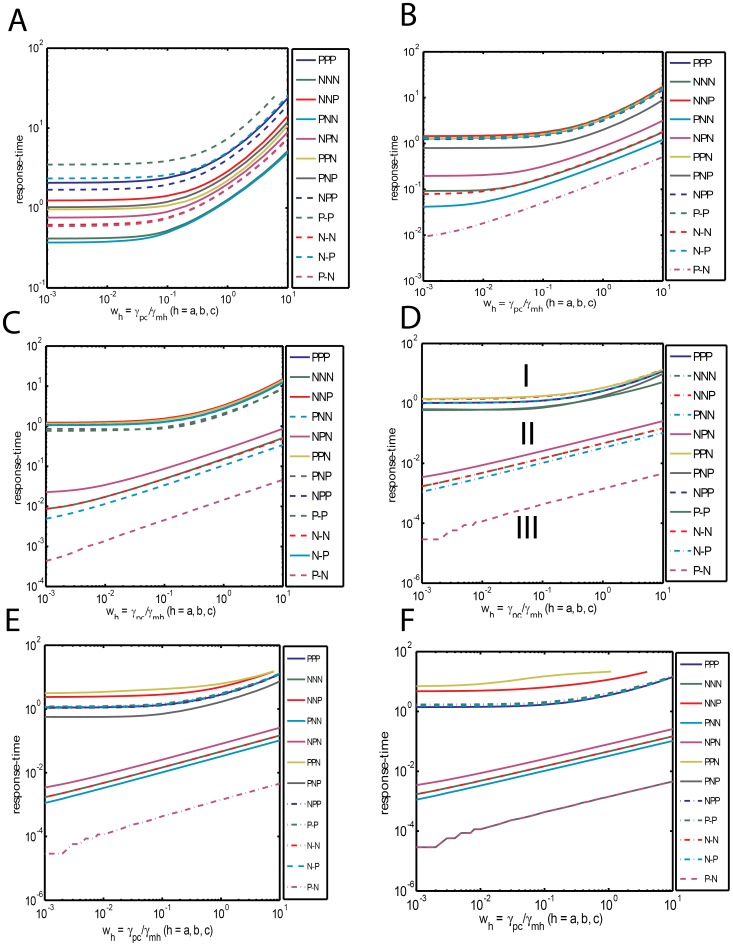
Figure 2. Dependency of response times on various sets of system parameters viz.
 = (wa, wb, wc),
  = (µab, µac, µbc, µyc, Lab) and
  = (vba, vca, vcb, εab, vcy). Response times are expressed in terms of number of generation times. A. Dependency of response times of various types of FFLs under weak binding conditions. Here the simulation setting are
  = 1,
= 1,  = 0.0003,
  = 4, Δτ = 5 x10⁻⁶, the total simulation time was set to T = 25 generation times and
  was iterated in the interval (0.001, 10) with Δ
 = 0.001. Under weak binding condition we observe that each of the considered FFLs behaves in a different way from others. B. Dependency of response times of FFLs
  . Settings are same as A with
  = 0.1. C. Dependency of response times of FFLs
  . Settings are same as A with
  = 0.01. D. Dependency of response times of FFLs
  . Settings are same as A however with
  = 0.001. Under this strong binding conditions all the considered FFLs segregate into three Groups namely I, II and III. It seems that PPP (C1) and PNP (I1) type FFLs show less variation with respect to changes in
  and also their response times are comparable with that of the unregulated C. E. Influence of increase in
  on the dependency of response times of FFLs on
  . Here
  = 0.003. This is the physiological value of
  for a typical yeast cell nucleus whose volume is ∼10 times higher than a bacterial cell. In this case, P-P type FLL shifts from the third subgroup of Group I to the second subgroup. F. Influence of changes in
  on the dependency of response times of FFLs on
  . Here
  = 0.03. This is the physiological value for a typical human cell nucleus whose volume is ∼100 times larger than a bacterial cell. In this case, PNP (I1) type incoherent FFL shifts to Group III.

