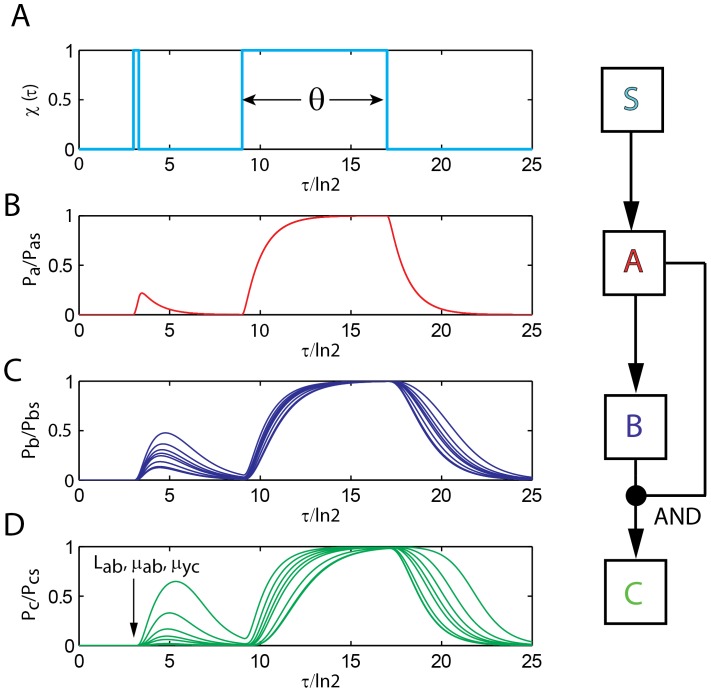
Figure 3. Dependency of filtering efficiency of P-P type (C1 type with AND-logic) FFL on the set of binding parameters .
 . Here the general settings are:
  = 0.12,
  = 0.0003,
  = 4, T = 25 generation times, and
  was varied as (0.1, 0.2, 0.3, 0.4, 0.5, 1, 3 and 5). A. Input signal at the promoter of TF gene A. This has one short rectangular pulse with a width of θ = 0.3 and a large one with θ = 8 all are measured in terms of number of generation times. B. TF gene A responds similarly for all values of
  to both the signals irrespective of the binding strengths. The response seems to be proportional to the pulse width θ without any delay. C. As binding strength increase, the response of B also increases proportionately. D. There exists a cutoff value of
  above which the expression level of TF gene C is practically zero. With the current settings, this cutoff seems to occur at
  = 1. Arrow shows the increasing direction of
  .
.

