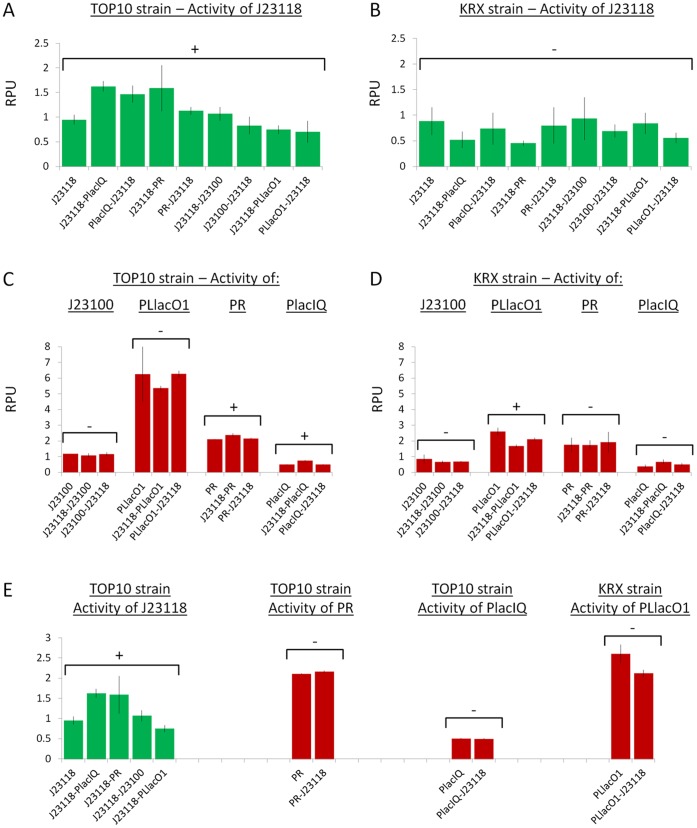
Figure 4. Measured RPU values for promoters assembled in the same plasmid in TOP10 and KRX strains.
Panels A-D show the measured promoters activities in all the tested conditions. Green and red bars indicate that the promoter has been characterized via GFP32 and RFP34 reporter device respectively. Error bars represent the standard deviation of the mean activity computed on three clones. For each group, the RPU value of the individually characterized promoter is also reported. Statistical analysis was performed via ANOVA test to compare the RPU activities measured in the tested conditions. Promoters showing a statistical difference (P ) in the mean activities among the tested conditions are marked with a ‘+’ sign, while promoters not showing any significant difference (P
 0.05) are marked with a ‘-’ sign. When a significant difference is present for a given promoter, the statistical analysis was also performed by excluding the conditions where the promoter drives the ‘downstream’ cassette and panel E shows the subset of conditions used for such comparisons, as well as the statistical analysis results. Strains with
  were induced with 1 mM of isopropyl
  -D-1-thiogalactopyranoside (IPTG).

