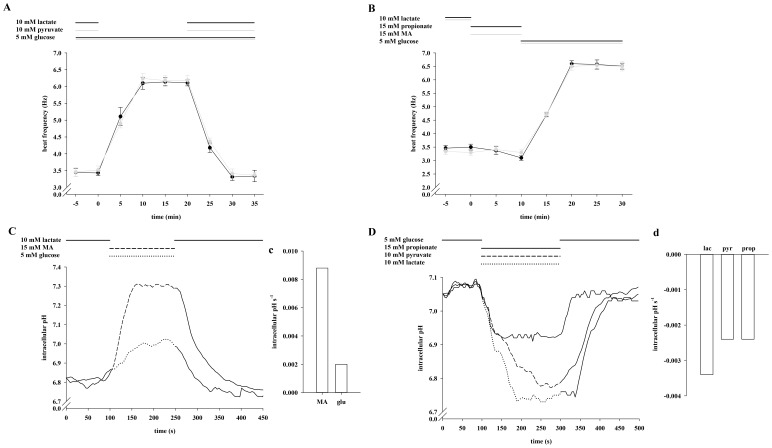
Figure 4. Lactate and pyruvate reversibly prevent the enhancing effect of glucose on sperm beat frequency.
A, Sperm were exposed to 5 mM glucose for 40 min. During the first 5 min and the last 15 min, either 10 mM lactate (black plot) or 10 mM pyruvate (gray plot) were co-applicated by continuous perifusion. Significant changes were analyzed relating to t = 0. At t = 5, 10, 15, 20 and 25 min, values were significantly increased (***p<0.001) in both plots compared to t = 0 min. B, Primarily, sperm were locally perifused with buffer HS containing 10 mM lactate. Then, stimulation occurred in the presence of 15 mM propionate (black plot) or 15 mM MA (gray plot) for 10 min, followed by another 20 min stimulation with 5 mM glucose. Compared to t = 0 min, the values were significantly increased at t ≥15 min (***p<0.001) after removal of propionate or MA. The plots of A and B represent mean values±s.e. of 41 cells of 3 animals. C, Sperm were perifused for 100 s with buffer HS containing 10 mM lactate before being stimulated with 15 mM MA (dashed line) or 5 mM glucose (dotted line) for 150 s. After stimulation, cells were again bathed for 200 s in lactate-containing buffer solution. D, After a 100 s-treatment with 5 mM glucose, cells were stimulated for 200 s with 15 mM propionate (solid line), 10 mM pyruvate (dashed line) and 10 mM lactate (dotted line) before perifusion was switched back to lactate-containing buffer for another 200 s. The plots of C and D represent mean values of 25–33 cells of 3 animals. Mean slopes in c and d were analyzed during the first 50 s during application of the different stimulatory substrates and are presented as intracellular pH s-1.

