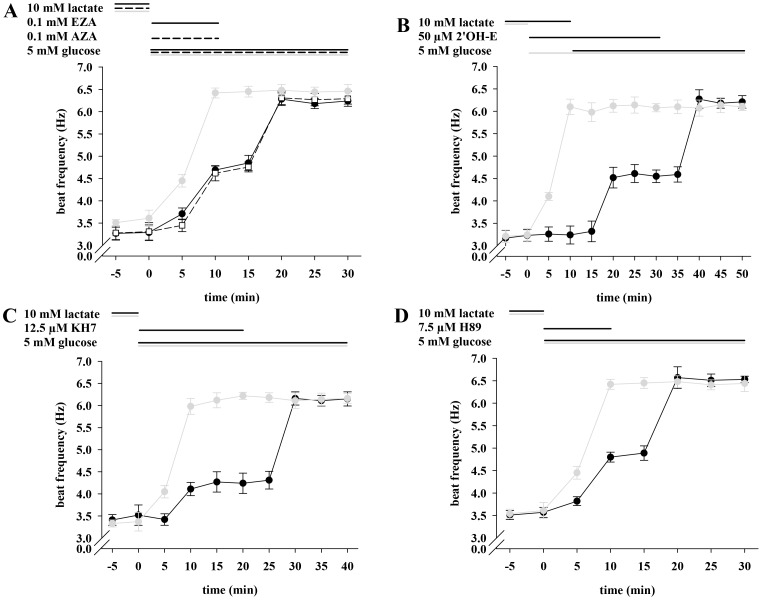
Figure 8. The enhancing effect of glucose on sperm beat frequency can be diminished with specific inhibitors against CAs, sAC and PKA. A,
Sperm were initially perifused with 10 mM lactate. Then, perifusion was switched for 10 min to buffer HS either containing 0.1 mM EZA (solid line and filled circles) or AZA (dashed line and open squares) with the additional presence of 5 mM glucose. Subsequently, sperm were stimulated for 20 min with 5 mM glucose only. In the control measurements (gray plot), sperm were stimulated the same way except for omitting CA inhibitors. Significant changes were analyzed relating to t = 0 min and accounted for ***p<0.001 at t ≥10 min under inhibiting and for ***p<0.001 at t ≥5 min in the control. B, Sperm were initially perifused with 10 mM lactate followed by application of 50 µM 2'OH-E for 10 min. For the next 20 min, sperm were stimulated with 50 µM 2'OH-E and 5 mM glucose. Subsequently, perifusion was switched for another 20 min to buffer HS containing 5 mM glucose only (black plot). Under inhibiting conditions, values were significantly increased (***p<0.001) at t ≥20 min and in the control at t ≥5 min. C, After perifusing with lactate, sperm were stimulated with 12.5 µM KH7 and 5 mM glucose for 20 min, and with 5 mM glucose only for another 20 min (black plot). In the respective control measurements (gray plots), sperm were treated the same way except for omitting sAC inhibitors. Significant changes were analyzed relating to t = 0 min and averaged at **p<0.05 (t ≥10 min) and at ***p<0.001 (t ≥30 min) under inhibiting conditions. In the control, significance values of **p<0.05 at t = 5 min and of ***p<0.001 at t ≥10 min were apparent. D, The same perifusion protocol was used as in A, whereupon 7.5 µM of the PKA inhibitor H89 was used instead of EZA and AZA (black plot). For control measurements (gray plot), sperm were perifused the same way except for omitting H89. Significant changes were analyzed relating to t = 0 min of the respective plot with ***p<0.001 at t ≥10 min under inhibiting conditions and ***p<0.001 at t ≥10 min in the control. In each plot mean values±s.e. of 35 cells of 3 animals are shown.

