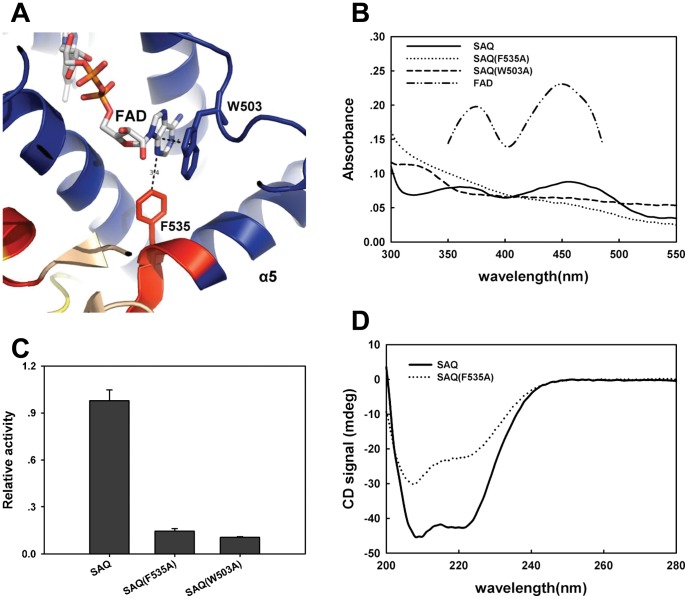
Figure 4. Dissecting the structure and function of the α5 helix of SAQ.
(A) The potential sites that bind the FAD purine ring were analyzed using PyMol. (B) UV/visible spectra of SAQ, SAQ F535A, SAQ W503A and FAD. The concentration of SAQ and its variants was 0.3 mg/mL, whereas that of FAD was 5 µM. An absorbance maximum for SAQ was observed in the range of 450 nm, but not for the two mutants. (C) Relative activity of SAQ, SAQ F535A, and SAQ W503A. The mutant variants were only 10% to 20% of the SAQ activity. (D) CD spectra of SAQ and SAQ F535A. The CD signal, as a function of wavelength, is displayed for SAQ and SAQ F535A at the same concentration.

