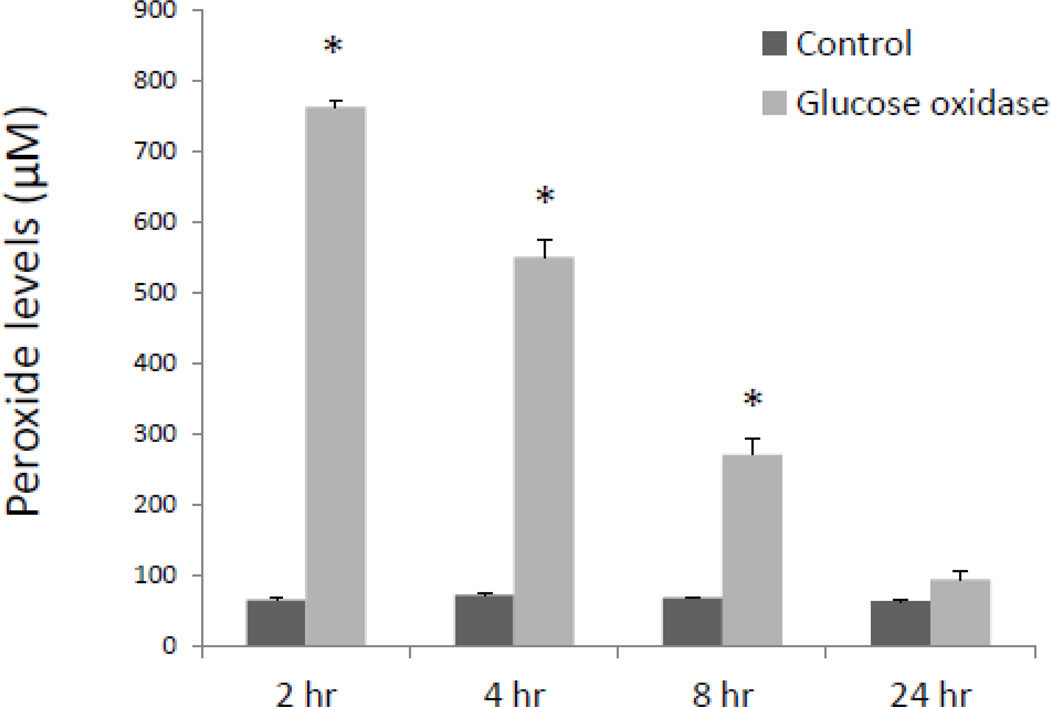
Figure 5. Time course of hydrogen peroxide concentration generated by glucose oxidase.
Medium was collected from wells containing human CASMC treated with glucose oxidase (5U/mL) for 2, 4, 8 and 24 h and assayed for peroxide. A large increase in hydrogen peroxide (~750 µM) was observed at 2 h and gradually declined, reaching ~250 µM by 8 h and ~60 µM by 24 h (*p<0.05, n=3, control vs. glucose oxidase).

