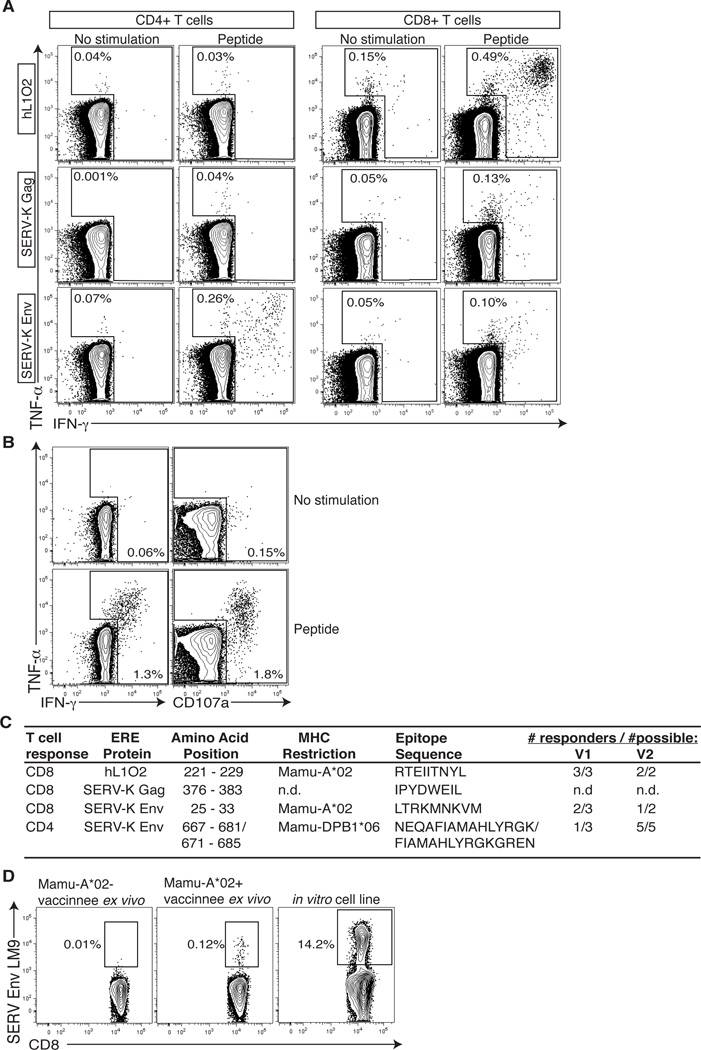
Figure 5. Characteristics of ERE-specific T cells.
A) Intracellular cytokine stain (ICS) of the largest responses against each ERE antigen directly ex vivo at two weeks post second boost using single 15-mer peptides identified by ELISPOT. Graphs were produced by gating on either CD4+CD3+ or CD8+ CD3+ cells as indicated. B) Representative data of hL1O2 response showing that ERE-specific T cells are able to mediate multiple effector functions. C) Summary of the characteristics of the four T cell responses shown in figure 5A. n.d. = not determined. D) Mamu-A*02 ERV-K Env LM9 tetramer staining of PBMC directly ex vivo in a Mamu-A*02 negative and positive animal two weeks following the final DNA boost. Also shown is a two week old in vitro expanded cell line as a positive control.

