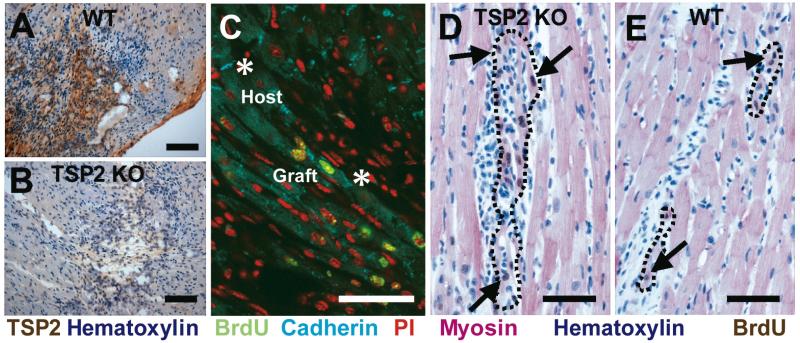
Figure 1. TSP-2 expression and graft integration.
Transplanted E14.5 cardiomyocytes express TSP-2 two weeks after engraftment in WT mouse hearts (A), but not in TSP-2 KO mice (B) (Bars=100 μm). (C) Confocal microscopy. Grafted cardiomyocytes (green nuclei) express cadherin (teal) and form cell junctions with each other and with host cells (asterisks). Propidium iodide was used as nuclear counterstain (red) (Bar=50μm). (D) BrdU (brown; arrows) labeled E14.5 cardiomyocytes express sarcomeric myosin (red), exhibit close apposition to host cardiomyocytes, and form larger grafts (outlined) in TSP-2 KO mice compared to WT controls (E). (Bar=50 μm)

