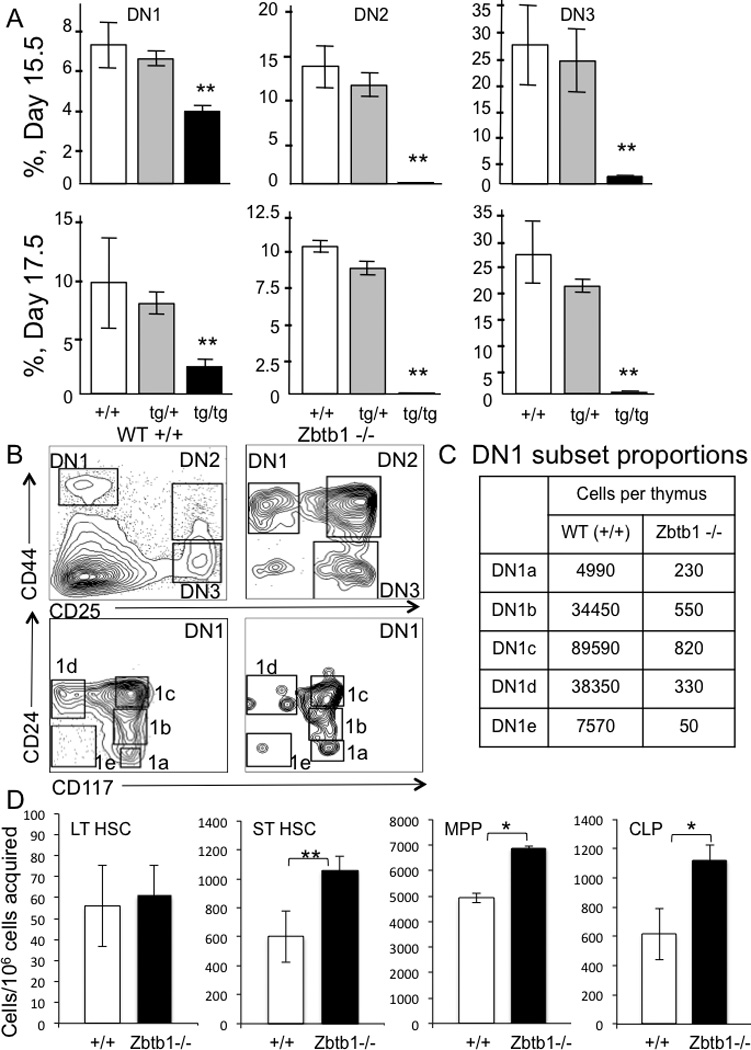
Figure 4. Analysis of thymocytes and bone marrow subsets in knockout mice.

A, day 15.5 and 17.5 fetal TCRβ− CD4− CD8− double negative (DN) thymocytes in wild type +/+, heterozygous tg/+ and homozygous transgenic tg/tg mice. DN1, CD25− CD44+, DN2, CD25+ CD44+, DN3 CD25+ CD44−. Percentages are means ± SD of 10 fetuses/group.
B, DN subsets from adult wild type and Zbtb1 knockout mice; DN1-DN3, upper plots; subdivided DN1 (lower plots) with DN1a, CD117+ CD24−; 1b, CD117+ CD24lo; 1c, CD117+ CD24+; 1d, CD117− CD24+; and 1e, CD117− CD24− [34].
C, DN1 cell subsets per thymus (n=2 per genotype).
D, bone marrow cell subsets from wild type and Zbtb1 knockout mice; long term HSC (LT HSC, LSK CD34− CD48−), short term HSC (ST HSC, LSK CD34+ CD48−), multi potent progenitors (MPP, LSK CD34+ CD48+), common lymphoid precursors (CLP, LSK CD127+ CD135+). Data represent mean ± SD, 10 mice per group; * p < 0.05, ** p < 0.001.
