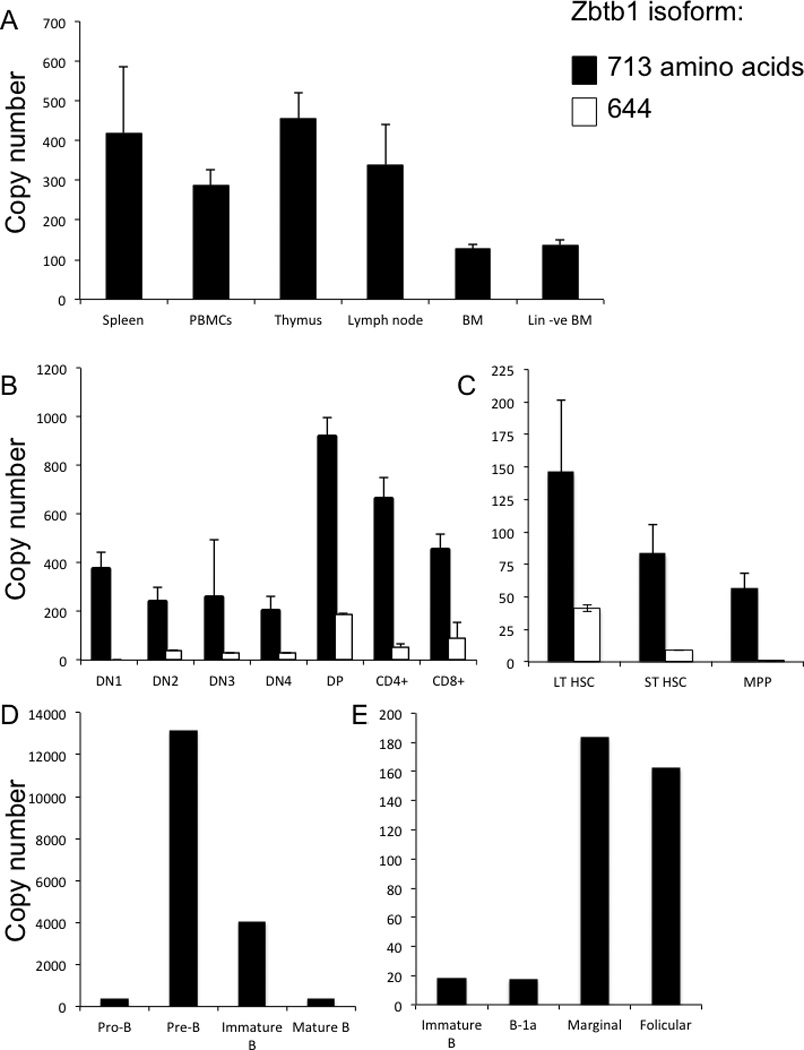
Figure 6. Zbtb1 mRNA expression measured by quantitative PCR in lymphoid populations in wild type mice.

A, spleen, PBMC, thymus, lymph node, bone marrow (BM), and bone marrow depleted of mature lineages (Lin –ve BM);
B, thymocyte subsets, as described in Figure 4A;
C, bone marrow progenitor populations, as described in Figure 4B.
D and E, bone marrow and splenic B lineage subsets, as described in Figure 5;
Y-axis shows copy numbers of Zbtb1 per 1000 copies of housekeeping gene HPRT.
Data represent mean ± SD, 5 mice per group.
