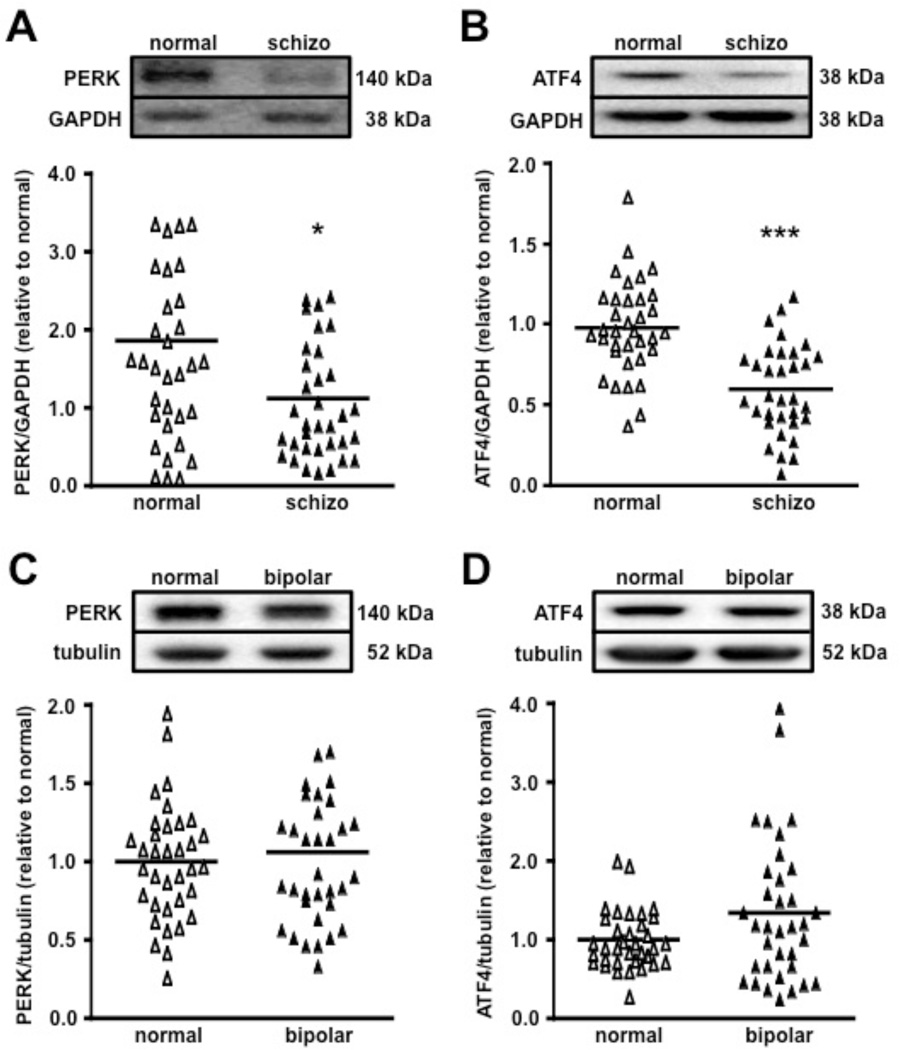
Figure 7. PERK and ATF4 expression is reduced in the frontal cortex of schizophrenic, but not bipolar patients.
(A) PERK expression levels normalized by GAPDH levels. normal, n=35; schizophrenia (schizo), n=35 (*p<0.05, one-way ANOVA). Scatter plots display the variability and differences in the protein expression leves normalized by each GAPDH expression levels. (B) Gene-specific translation of ATF4 is reduced in the frontal cortex of schizophrenic patients. normal, n=35; schizo, n=33 (***p<0.001, one-way ANOVA). (C) PERK expression levels do not differ between control and bipolar patient brain samples. PERK expression normalized by tubulin levels. normal, n=35; bipolar, n=35 (p>0.05, n.s., one-way ANOVA). (D) ATF4 expression remains unaltered in the frontal cortex of bipolar patients compared to normal controls. normal, n=35; bipolar, n=35 (p>0.05, n.s., one-way ANOVA). A crossbar on each scatter plot represents mean expression levels for each group.

